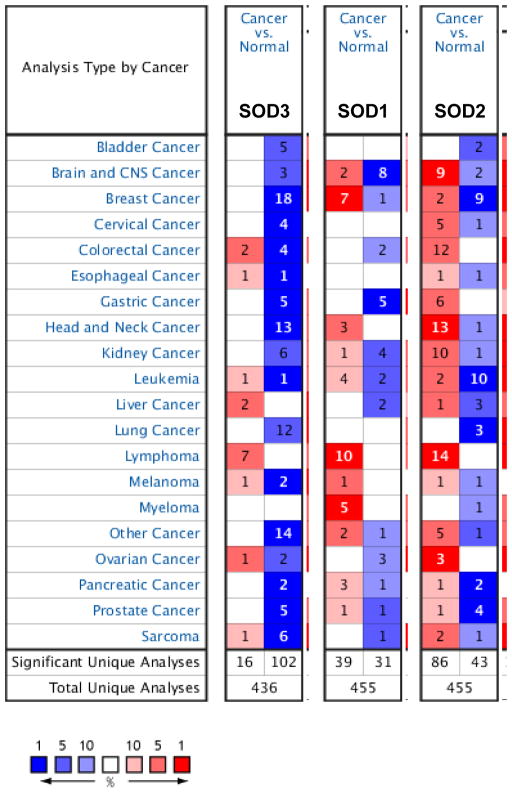
Figure 2.
Oncomine gene summary view comparing the number of datasets that had significant changes in mRNA expression for EcSOD (SOD3), CuZnSOD (SOD2), and MnSOD (SOD2) in cancer versus normal tissues. Thresholds were set for P<0.01 and top 10% score in gene rank for most significantly changed genes. Blue boxes indicate downregulation and red represents upregulation. Number in each box shows the number of analyses that met the thresholds.

