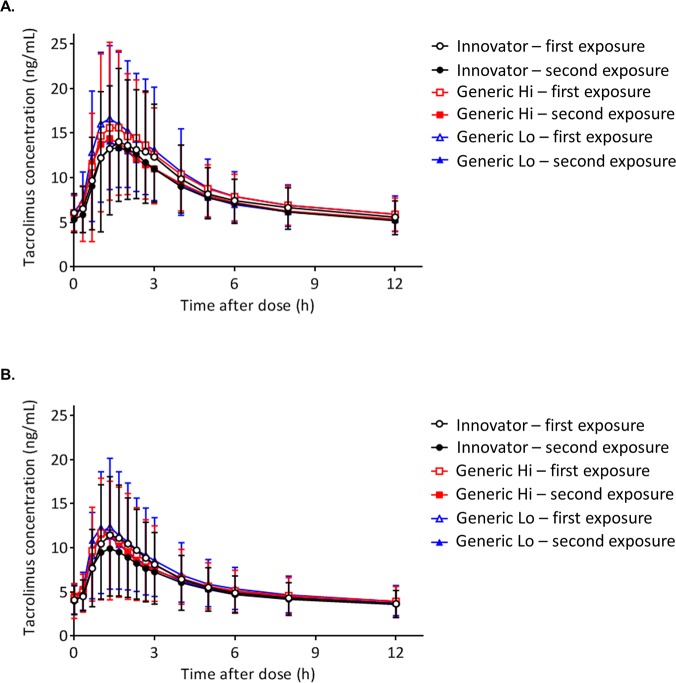
Fig 3. Comparison of tacrolimus time concentration curves by product.
(A) Individuals with a kidney transplant. (B) Individuals with a liver transplant. Fifteen tacrolimus blood samples were collected at C0 (before the morning dose) and at 20, 40, 60 (1 hour), 80, 100, 120 (2 hours), 140, 160, and 180 (3 hours) minutes and 4, 5, 6, 8, and 12 hours to construct the tacrolimus concentration-time curves. Each tacrolimus product—Innovator, Generic Hi, and Generic Lo—was administered according to the randomly assigned treatment sequence (Fig 1) twice for 1 week before collection of steady-state pharmacokinetic profiles. Each point on the curve displays the tacrolimus mean whole blood concentrations; standard deviations are depicted by error bars. There were no statistically significant differences between any time points.

