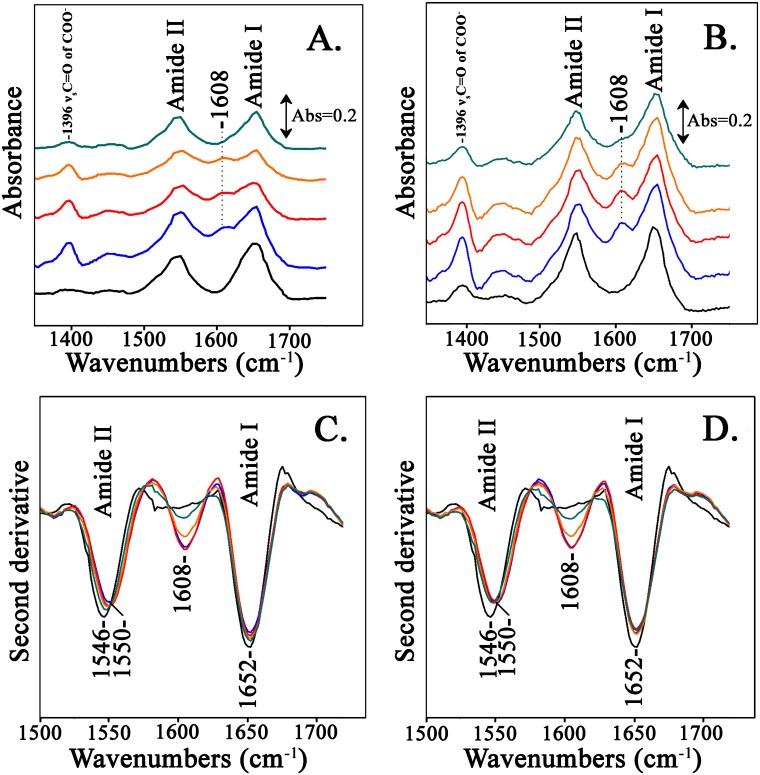
Fig 4. ATR-FTIR spectra of hemoglobin with added LC fractions 2–5 (Black: Hb, Blue: Hb + fraction 2, Red: Hb + fraction 3, Orange: Hb + fraction 4, Cyan: Hb + fraction 5).
Panel A. Fractions 2–5 are from the reaction of asparagine with glucose. Panel B. Fractions 2–5 are from the reaction of asparagine with fructose. Panel C. Second derivative spectra of those presented in panel A. Panel D. Second derivative spectra of those presented in panel B.

