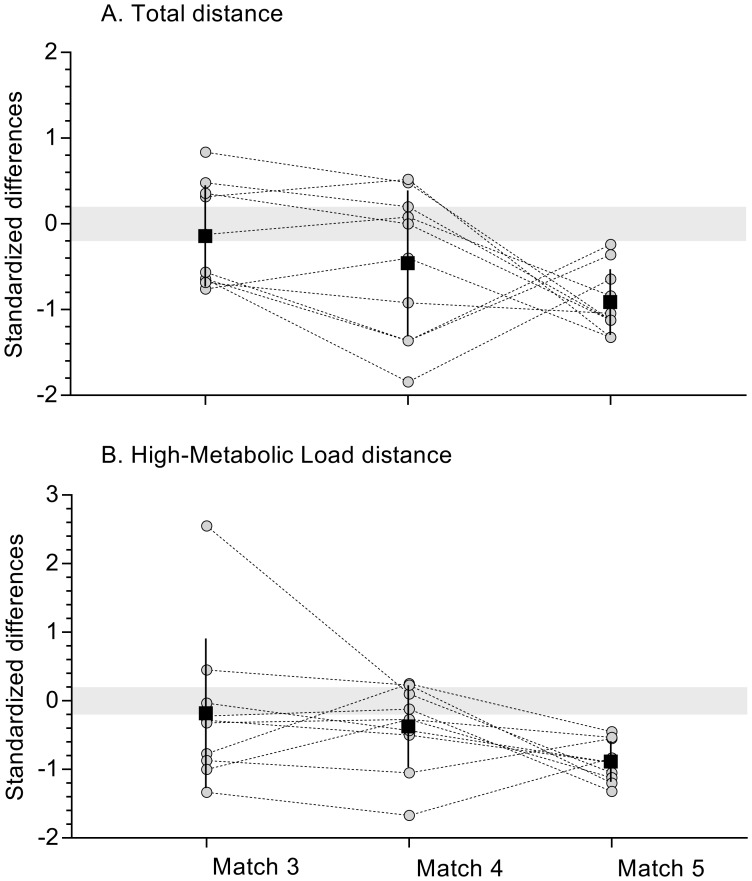
Fig 2. Differences in total distance covered (panel A) and high metabolic load distance covered (panel B) between the mean 10-min versus the final 10-min period, from match 3 to match 5.
Grey zone stands for trivial zone (effect size ± 0.2). Grey circles: Individual observations. Black circle and bar: Mean and standard deviation.

