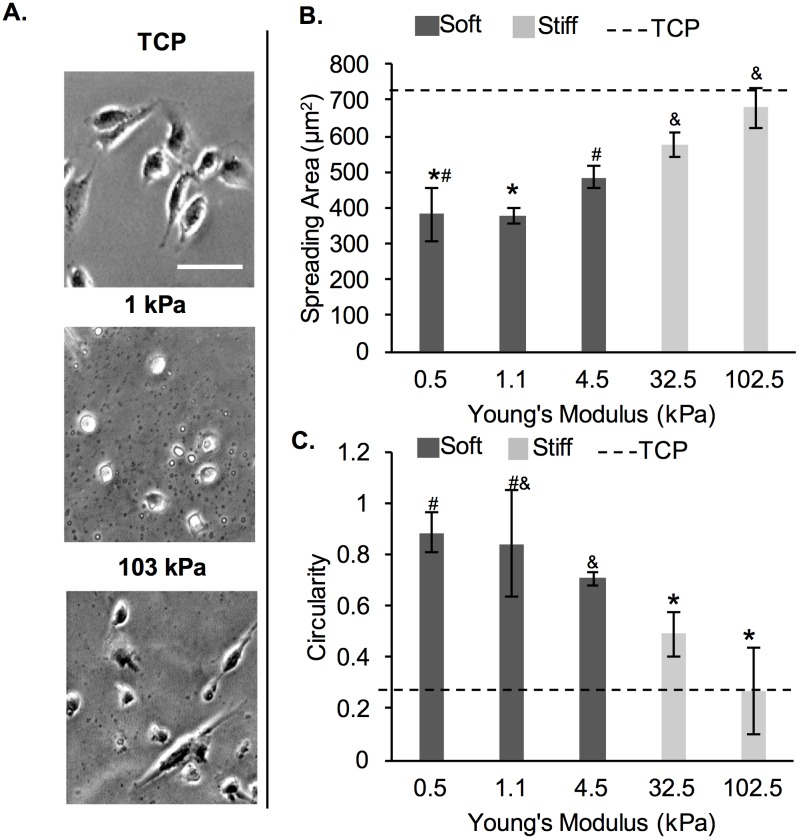
Fig 1. MDA-MB-231 cells on PA gels of varying stiffness.
(A) Representative phase contrast cell images taken at 24 h post-seeding. Scale bar is 50 μm. (B) Cell spreading area and (C) circularity at 24 h post-seeding. The dashed line represents values on TCP. *,#,$ represent significant difference from each other, where same symbol represents no difference (p<0.05, n = 3).

