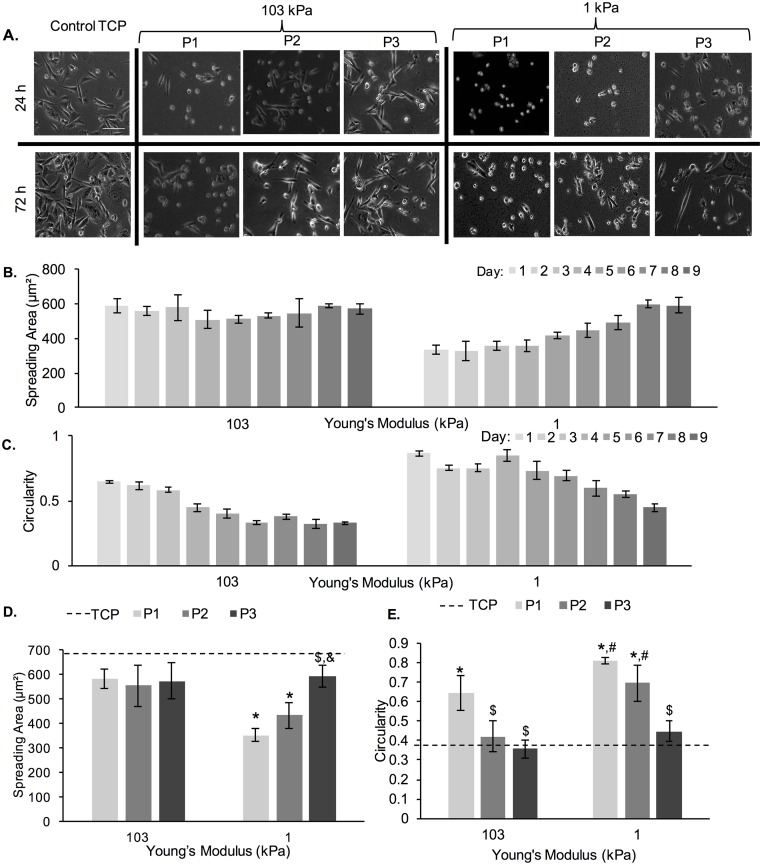
Fig 4. Cell spreading area and circularity of MDA-MB-231 cells as a function of adaptation to substrate stiffness.
(A) Representative phase contrast images of MDA-MB-231 cells on 1 kPa and 103 kPa PA gels. Scale bar is 100 μm. (B) Cell spreading area and (C) circularity of MDA-MB-231 cells on 1 kPa and 103 kPa PA gels as a function of culture time. Note that cells were re-passaged every 3rd d for a total of 9 d. (D) Cell spreading area and (E) circularity as measured at 72 h of each passage (P1, P2 and P3). The dashed line represents cell spreading area and circularity on TCP. *represent significant difference from TCP, #represent significant difference from 1 kPa, $represent significant difference from P1 (p<0.05, n = 3).

