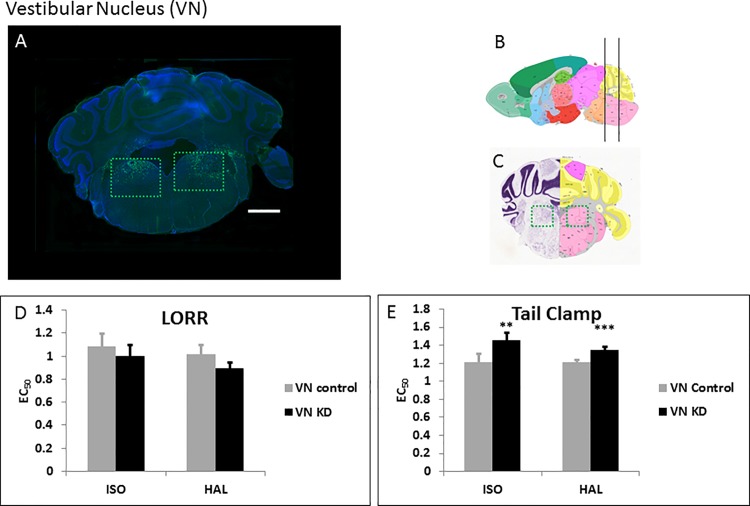
Fig 2. Knockdown of Ndufs4 in the VN.
A. Fluorescent images of brain slices from mice injected with active WT-Cre virus into the VN (Coordinates: ML = ± 1.25; AP = -5.8; DV = 4.3, Magnification X40). Virus-infected cells appear green due to the viral GFP co-expression B, C. Schematic figures from the Allen mouse brain atlas [24] (Image credit: Allen Institute) depicting the antero-posterior (B), mediolateral (C) and dorso-ventral (C) viral spread (green boxed regions in C). Reprinted from the Allen mouse brain atlas under a CC BY license, with permission from the Allen Institute, original copyright 2008. D. EC50s for ISO and HAL for the active (n = 7, black bars) and sham (n = 6, grey bars) virus injected mice in the LORR assay. E. EC50s for ISO and HAL for the active (n = 7, black bars) and sham (n = 6, grey bars) virus injected mice in the TC assay. Scale bar: 1mm. **indicates p-values <0.005, *** indicates p-values <0.001. The error bars in all bar graphs indicate standard deviation.

