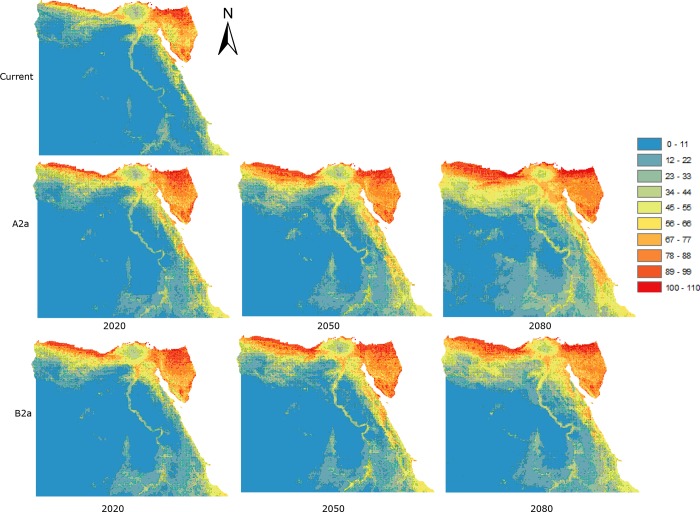
Fig 2. Predicted patterns of species richness using binary distributions for the present-day (‘current’) and into the future (2020, 2050, 2080) under two climate-change scenarios (A2a and B2a), created by adding together the maps of all 114 species and assuming unlimited dispersal.
The colours indicate predicted species richness ranging between dark red (high) and blue (low).

