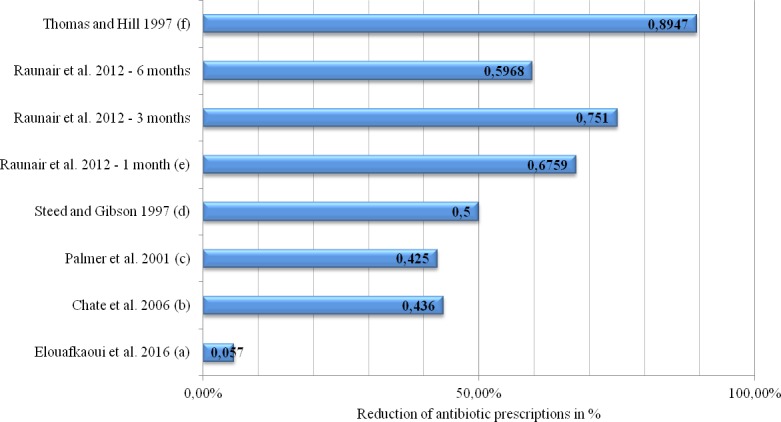
Fig 2. Decrease in the number of prescriptions for antibiotics in percentage, by studies assessing this outcome parameter.

Note: Chopra et al. (2014) and Zahabiyoun et al. (2015) do not report that outcome measure. Instead of reporting figures, odds ratios are reported in Seager et al. (2006). (a) Reduction of 1.0 antibiotic items per 100 NHS treatment claims in the intervention group compared to 0.4 antibiotic items in the control group. (b) Reduction from 2,951 prescriptions for antibiotics before the audit to 1,665 prescriptions after the audit. (c) Reduction from 2,316 prescriptions for antibiotics before the audit to 1,330 prescriptions after the audit. (d) The number of prescriptions was not stated in the paper, but the authors report an overall reduction of ~50%. (e) Reduction of the total number of prescriptions for antimicrobial agents from 253 prescriptions among 300 patients at baseline to 82 prescriptions among 300 patients at one month after the intervention. Three months after the intervention these prescriptions were at 63 among 300 patients and at 102 prescriptions among 300 patients six months after the intervention. (f) Reduction of preoperative prescriptions for antibiotics from 15 prescriptions among 80 patients before the audit to one prescription among 52 patients after the audit. A postoperative reduction of prescriptions for antibiotics was not intended.
