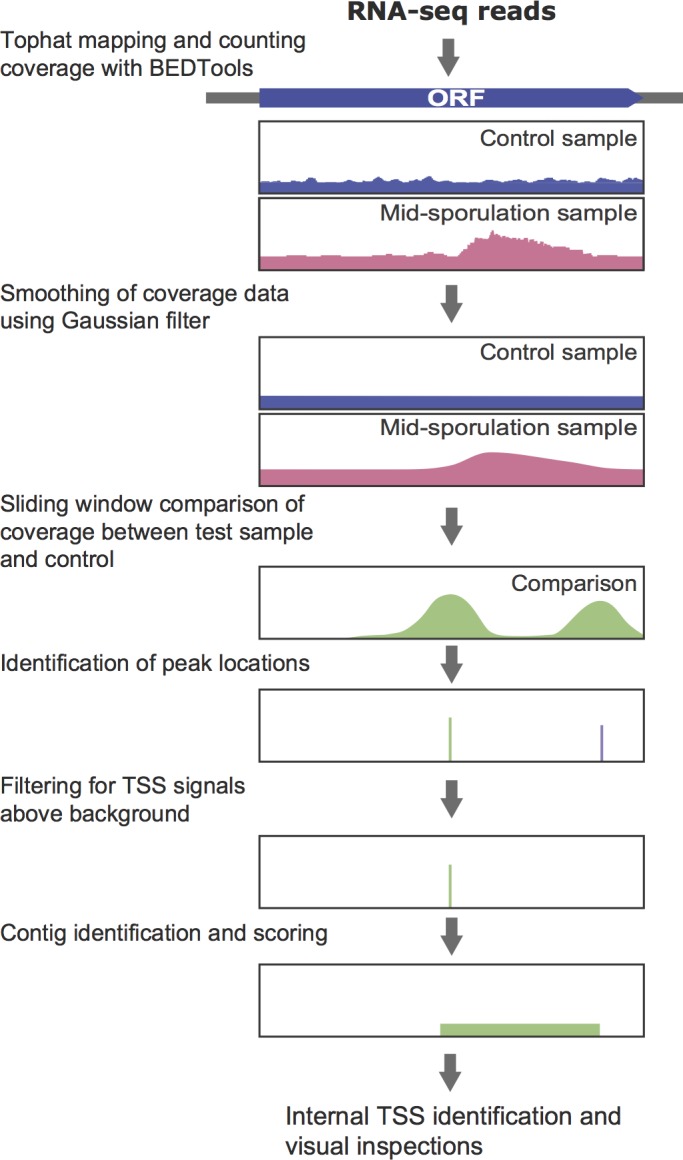
Fig 1. Analytical flowchart for calling mid-sporulation specific internal TSSs from RNA-Seq data of control and mid-sporulation samples.

RNA-seq reads of synchronized yeast meiotic culture with PCUP1-IME1 PCUP1-IME4 strain at IME1 and IME4 induction (2 h in SPO) and mid-meiosis (3.75 h, 4 h and 4.25 h after addition of copper) (GSE90008) was used. Analysis flow for a pair of samples is shown as an illustrative example. Reads were aligned to reference assembly (Saccharomyces cerevisiae S288C R64.1.1) using TopHat, then quantified as absolute read counts with BEDTools. Coverage data smoothing was performed by the application of a Gaussian kernel on genome-wide read counts. Using sliding windows along the whole genome, the root mean squared deviation between normalized coverage curves of control and test samples reports the shape difference between the curves in each window. Shape difference peaks were filtered to remove potential TES signals (purple line) and signals from noise. For each TSS signal, transcript boundaries were defined into a contig from the difference in smoothed coverage between control and test samples. Close contigs were merged, assigned a score (product of the average of shape difference values and contig size) and ranked. Contigs identified more than once in the analysis of 3 mid-meiotic samples were further evaluated for whether they were internal to known ORFs. Finally, genes with mid-sporulation specific internal TSSs were filtered at an average contig ranking cutoff of 800 and visually examined. Detailed analysis procedures are described in Material and Methods.
