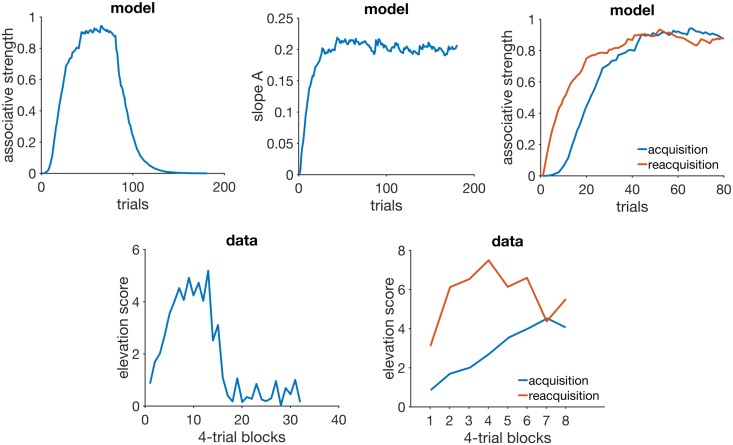
Fig 3. Acquisition and reacquisition.
Top left: simulated associative strength V in acquisition and extinction. Top middle: adaptation of RWDDM slope A. CR extinction began at trial 80 but has no effect on the RWDDM slope. Top right panel: simulated V curves in acquisition and reacquisition. Bottom left panel: response strength data from an experiment in acquisition and extinction, redrawn from Fig 1 in [77]. Bottom right panel: data from an experiment in acquisition and reacquisition, redrawn from the top panel of Fig 3 in [77]. Model parameters: m = 0.15, θ = 1, σ = 0.3, αt = 0.1, αV = 0.1, H = 4 in acquisition and H = 0 in extinction.

