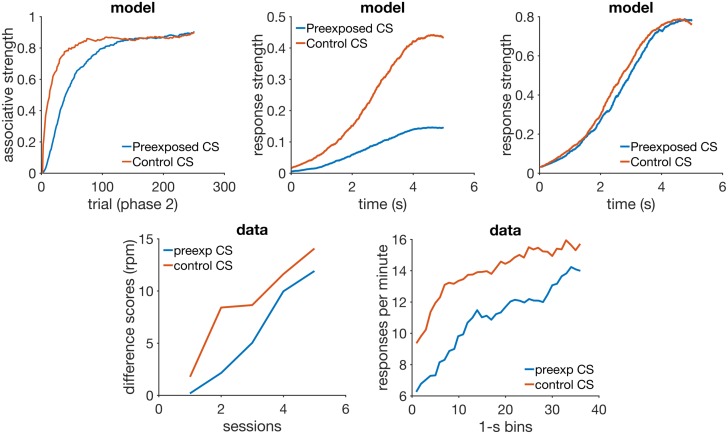
Fig 6. Latent inhibition.
Top row: simulated associative strength in latent inhibition (left), simulated CR averaged over the first 30 trials of conditioning phase (middle), and simulated CR averaged over the last 30 trials of conditioning phase (right). Bottom row: acquisition curves from an actual experiment in latent inhibition (left), and response rate data during the CS (right). Data plots redrawn from Figures 1 and 2 respectively in [70]. Model parameters: αt = 0.1, αV = 0.08, μ = 1, σ = [0.6 − 0.35], m = 0.2, H = 4, αPH = 0.4, γ = 0.03.

