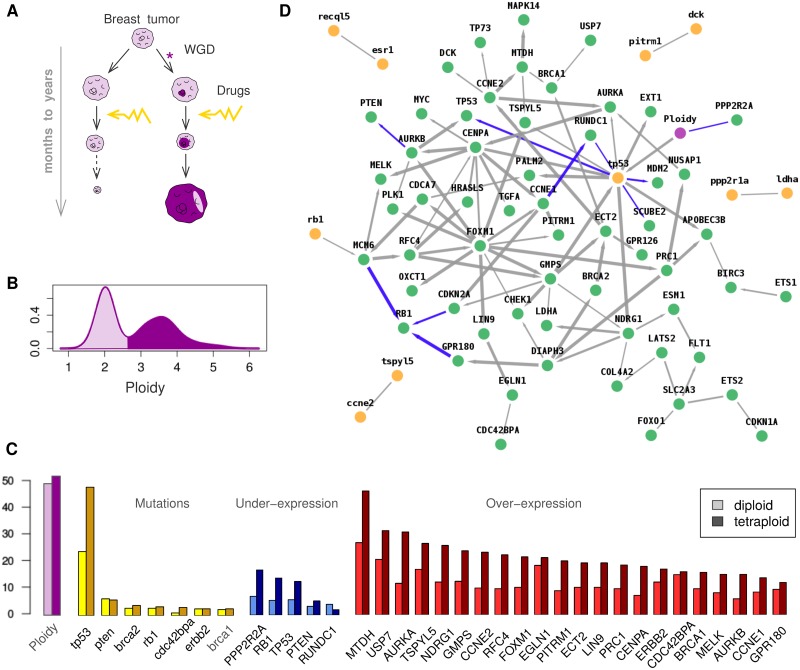
Fig 3. Network reconstruction at tissue level.
(A) Tumor development and drug resistance in the presence of tetraploid tumor cells following whole genome duplication (WGD). (B) Ploidy distribution in the 807 tumor samples and (C) genomic alterations: ploidy, mutations, normalized under-expression and over-expression changes from COSMIC database [34]. (D) Genomic alteration network obtained between average ploidy (violet), gene mutations (yellow, lower case) and under- or over-expressions (green, upper case). Graph predicted with miic R-package and visualized using cytoscape (blue edges correspond to repressions).

