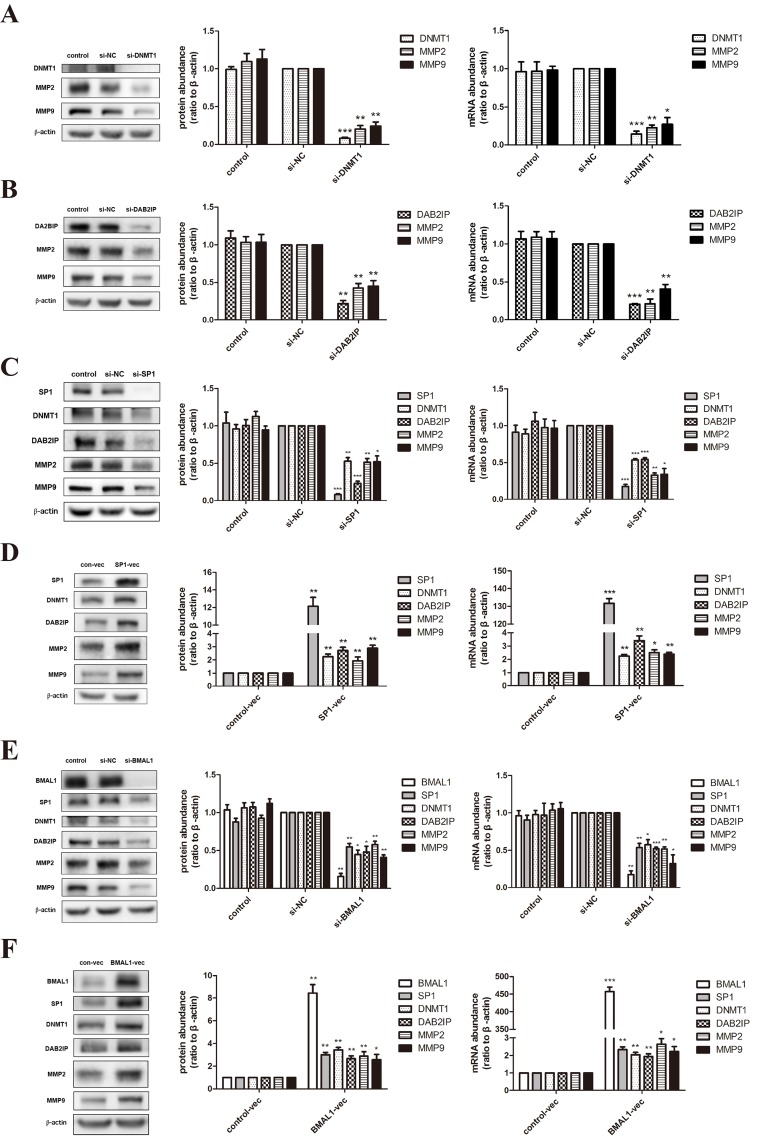
Figure 2. BMAL1 promoted SP1-induced DNMT1 and DAB2IP, and further regulated MMP2 and MMP9 in HTR-8/SVneo cells.
A. The mRNA and protein abundance of DNMT1, MMP2 and MMP9 after DNMT1 knock-down in HTR-8/SVneo cells. The panel from left to right is the representative images of western blot assays, the immunoreactive bands densitometrically quantified and mRNA abundance. B. The mRNA and protein abundance of DAB2IP, MMP2 and MMP9 after DAB2IP knock-down in HTR-8/SVneo cells. C. The mRNA and protein abundance of SP1, DNMT1, DAB2IP, MMP2 and MMP9 after SP1 knock-down in HTR-8/SVneo cells. D. The mRNA and protein abundance of SP1, DNMT1, DAB2IP, MMP2 and MMP9 after SP1 over-expression in HTR-8/SVneo cells. E. The mRNA and protein abundance of BMAL1, SP1, DNMT1, DAB2IP, MMP2 and MMP9 after BMAL1 knock-down in HTR-8/SVneo cells. F. The mRNA and protein abundance of BMAL1, SP1, DNMT1, DAB2IP, MMP2 and MMP9 after BMAL1 over-expression in HTR-8/SVneo cells. β-Actin was used as a loading control. Blots are representative, and data are means ± SEM from four to five experiments. * P < 0.05, ** P < 0.01, *** P < 0.001 against si-NC cells or against control-vec cells.

