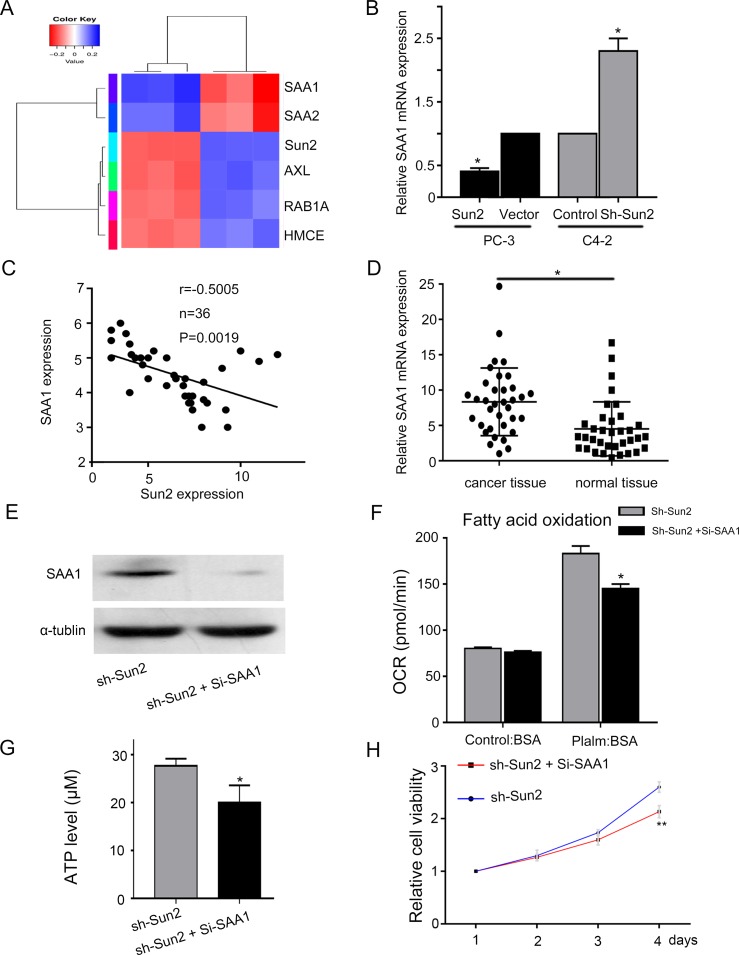
Figure 6. The underlying mechanism of FAO regulated by Sun 2 in prostate cancer.
(A) Differentially expression genes of RNA in sh-Sun2 and control areshown in the form of a heat map. (B) SAA1 expression was evaluated in overexpression and knockdown of Sun2 cell lines compared with control by RT-PCR analysis. (C) Correlation between Sun2 expression and SAA1 expression was observed in the prostate cancer tissues (n = 35). (D) Expression of SAA1 mRNA in prostate cancer tissues vs., matched adjacent normal tissues (n=35). (E) Si-SAA transfection efficiency was identified by western blot. (F) FAO was evaluated in sh-Sun2 stable cell lines with Si-SAA transfection vs. Sun2 stable cell lines. (G) ATP level was evaluated in sh-Sun2 stable cell lines with Si-SAA transfection vs. Sun2 stable cell lines. (H) Cell viability was evaluated in sh-Sun2 stable cell lines with Si-SAA transfection vs.Sun2 stable cell lines. *P < 0.05, **P < 0.01.

