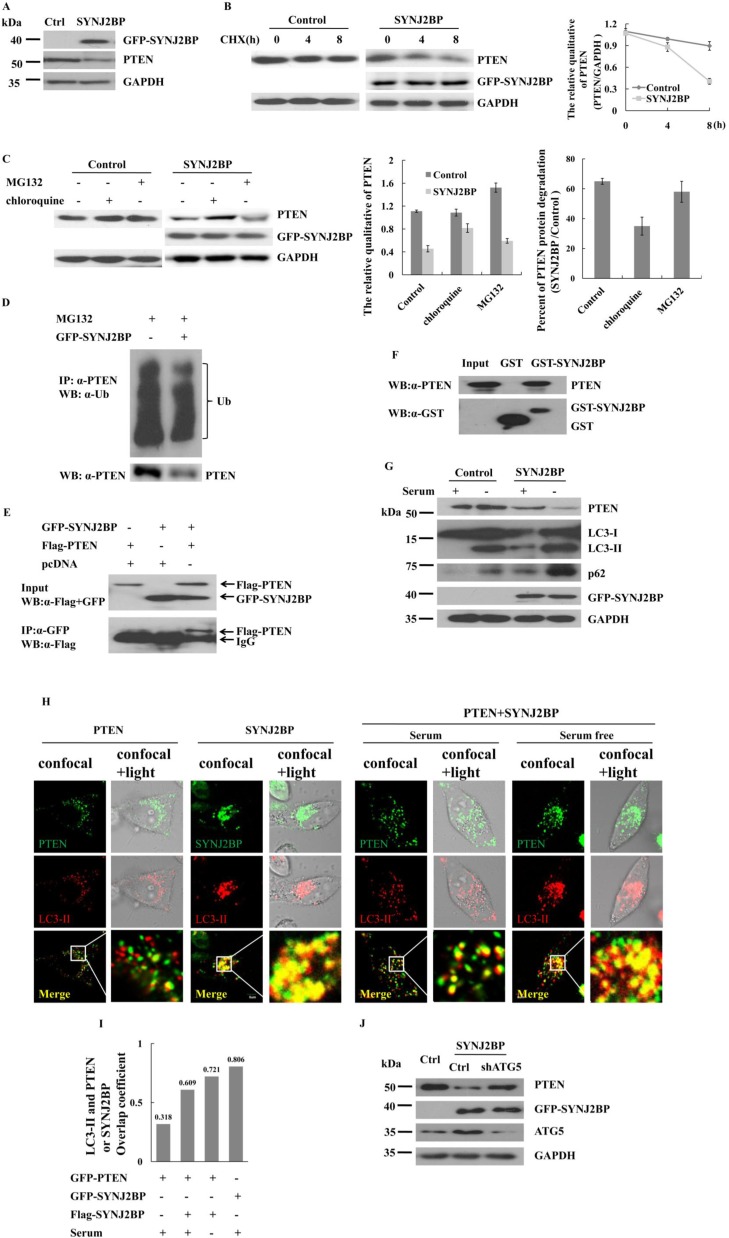
Figure 5. Effects of SYNJ2BP on the expression of PTEN.
(A) Western blot showing that effects of SYNJ2BP overexpression on PTEN expression. Cells were transfected with GFP- SYNJ2BP or control vector and collected after 22 h. (B) Western blot showing that effects of SYNJ2BP overexpression on PTEN level. Cells transfected with GFP- SYNJ2BP or control vector and treated with 10 mg/ml cycloheximide (CHX) for different periods of time (0, 4, 8 h) before being subjected to western blot. The graph shows the relative intensity of the PTEN band at different time points. The level of PTEN protein for 0 h in control or SYNJ2BP cells was set to 1, respectively. (C) Western blot showing that effects of SYNJ2BP overexpression on PTEN degradation. MCF-7 cells transfected with GFP-SYNJ2BP or control vector and treated without or with 10 mM MG132 or 50 μM chloroquine for 8 h. The samples were subjected to western blot analysis with the indicated antibodies. Quantified protein levels of PTEN (relative to GAPDH) was plotted in the left bar graph. SYNJ2BP-induced PTEN degradation by lysosome and proteasome pathway were plotted by a percentage in the right bar graph. (D) Co-IP assay showing that effects of SYNJ2BP overexpression in PTEN ubiquitylation. (E) Co-IP assay showing the interaction between exogenous SYNJ2BP and PTEN. MCF-7 cells were cotransfected with Flag-PTEN and GFP-SYNJ2BP. After 24 h of transfection, the cells were subjected to immunoprecipitation with anti-GFP antibody, followed by western blot analysis with anti-GFP antibody. (F) GST-pull down assay showing the interaction between GST-SYNJ2BP and endogenous PTEN. (G) Western blot showing that effects of SYNJ2BP overexpression on PTEN, LC3 and p62 level. Cells were transfected with GFP-SYNJ2BP or control vector for 22 h and then treated with or without serum 2 h before lyses. (H) Subcellular localization of PTEN or SYNJ2BP shown by confocal fluorescence microscopy. MCF-7 cells were transfeced with GFP-PTEN or GFP-SYNJ2BP alone or Flag-PTEN and GFP-SYNJ2BP and treated with or without serum. LC3-II was used to indicate autophagy-lysosome. Merged images are shown in bottom panels. The merge of confocal and transmitted light showing protein distribution of inside the cells (right). (I) Quantification of the colacalization between PTEN and LC3-II in control or SYNJ2BP overexpression cells and treated with or without serum, using overlap coefficient. (J) Western blot analysis showing the reversion of repressed PTEN expression in ATG5-knockdown cells by overexpression of SYNJ2BP. MCF-7 cells without or with ATG5-knockdown were transfected with SYNJ2BP or control and the levels of PTEN, ATG5 and GAPDH in the cells were analyzed by western blot.

