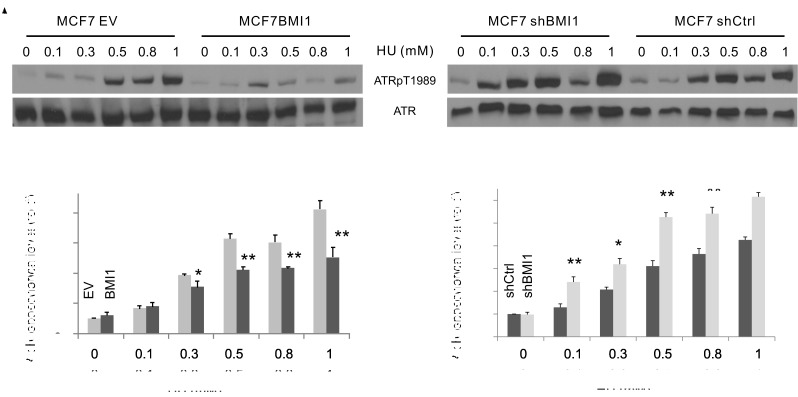
Figure 3. BMI1 reduces ATR activation.
Examination of phosphorylation of ATR at T1989 (ATRpT1989) in the indicated MCF7 cell lines. Experiments were repeated three times; typical images from a single repeat are shown (A). (B, C) ATR phosphorylation was normalized to the respective ATR and expressed as fold changes to the normalized ATR phosphorylation levels in the respective (EV and shCtrl) control (untreated) cells. Means ± SD (standard derivation) were graphed; *p < 0.05 and **p < 0.01 by 2-tailed Student's t-test in comparison to the respective controls.

