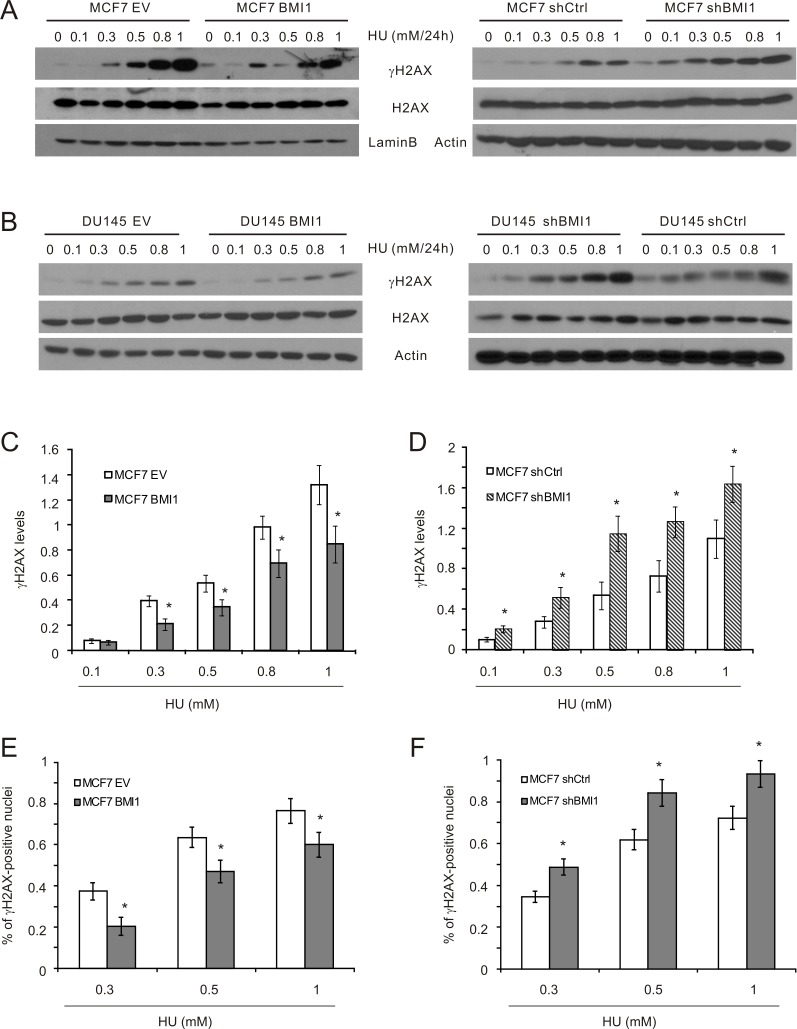
Figure 4. BMI1 attenuates γH2AX in cells treated with HU.
(A, B) The indicated MCF7 and DU145 cell lines were exposed to HU at the indicated doses for 24 hours. The indicated events were examined by Western blot. Experiments were repeated three times. Typical results from a single repeat were included (A, B). γH2AX results for MCF7 EV, BMI1 (C), shCtrl, and shBMI1 (D) cells were quantified. Means ± S.E were graphed. *p < 0.05 in comparison to the respective control cells (two-tailed Student's t-test). (E, F) MCF7 EV, BMI1 (E), shCtrl, and shBMI1 (F) cells were treated with PBS or HU for 24 hours. IF staining for γH2AX was performed. Typical images are presented in Supplementary Figure 5. Experiments were repeated three times; γH2AX-positive nuclei were quantified; mean percentages ± S.E are graphed. *p < 0.05 in comparison to the respective control cells (two-tailed Student's t-test).

