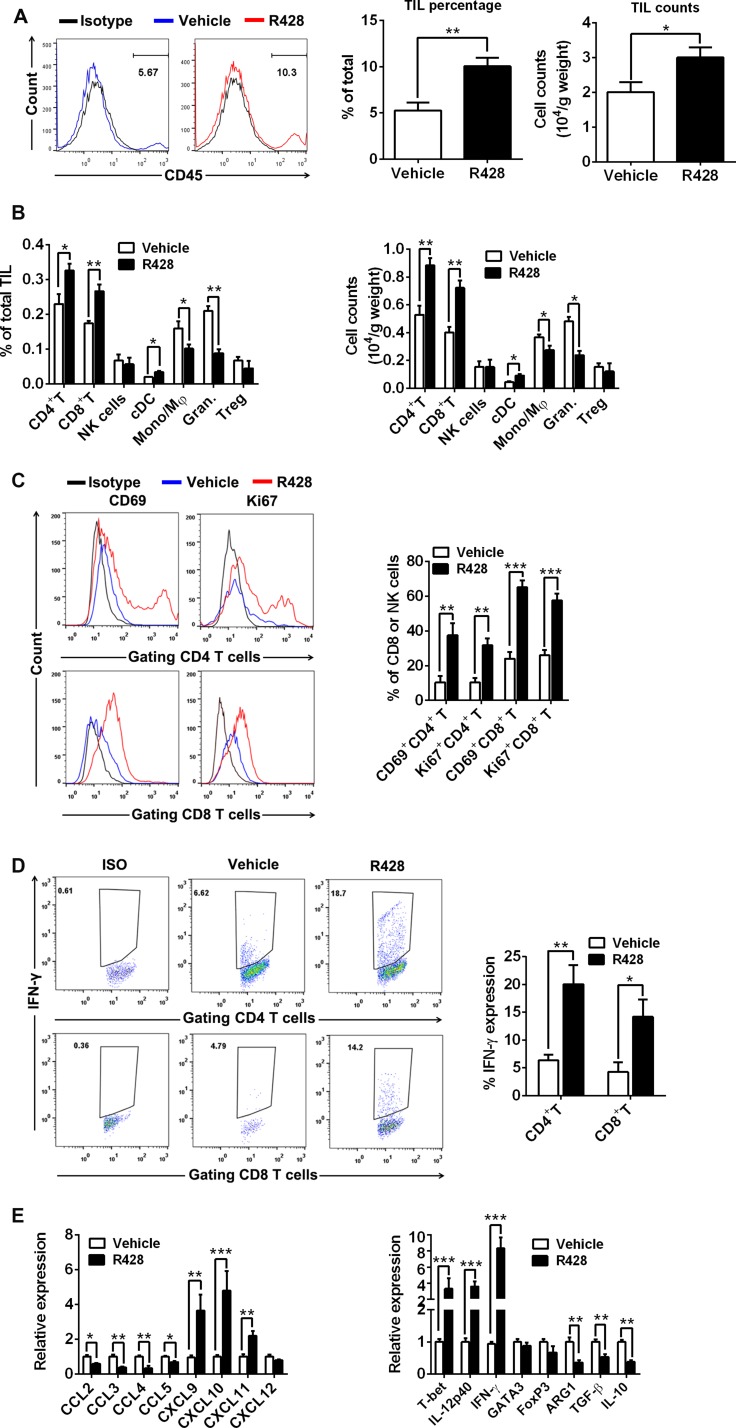
Figure 4. Immune effector mechanisms induced by Axl inhibition.
C57BL/6 mice (3 per group) bearing 10-day-established ID8 tumors were treated with control vehicle or R428 for 5 days and then TILs and immune-associated genes within tumors were analyzed by FACS and qPCR respectively. (A) The representative FACS plots, the percentage and absolute number of CD45+ TILs in tumors from vehicle or R428 treated mice. (B) The percentage and absolute number of CD4+ FoxP3– T cells, CD8+ T cells, CD3+ DX5+ NK cells, CD11c+ MHCII+ cDCs, CD11b+ F4/80+ Ly-6G– monocytes/macrophages (Mono/Mφ), CD11b+ F4/80– Ly-6G+ granulocytes and CD4+FoxP3+ Treg cells within TILs. (C) The percentages and representative FACS plots of CD69+ and Ki-67+ cells among tumor-infiltrating CD4+ T cells and CD8+ T cells. (D) The percentages and representative FACS plots of IFN-γ+ cells among tumor-infiltrating CD4+ T cells and CD8+ T cells in response to phorbol myristyl acetate (PMA)/Ionomycin stimulation. (E) The expression of genes associated with type-1 T cell or suppressive cells recruitment and functionality. Mean values of messenger RNA levels in control group were set to 1. Data are derived from three tumors per treatment and representative of two independent experiments, *p < 0.05, **p < 0.01, ***p < 0.001, two-tailed student t test.

