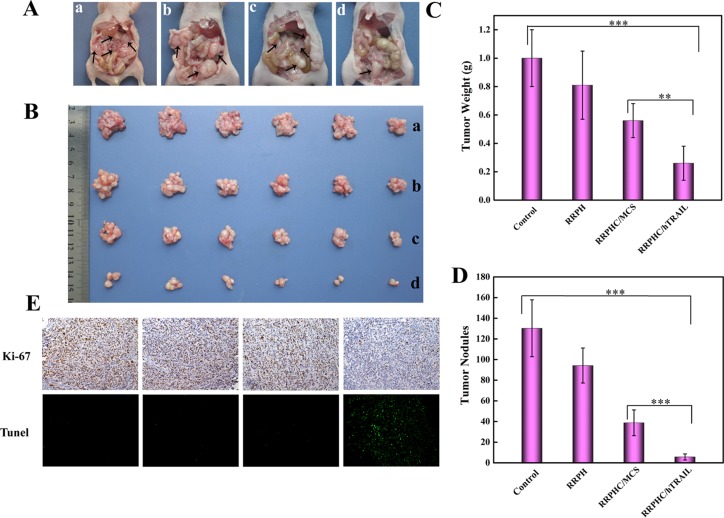
Figure 10. In vivo anti-tumor potency evaluation.
(A, B) Representative photographs of abdominal metastatic nodes (arrows) in each treatment group. PBS (a), RRPH polymer (b), RRPHC/MCS (c), and RRPHC/hTRAIL (d). (C, D) Tumor weights and tumor nodules after treatment with different formulations. (E) IHC analyses of the expression of Ki-67 and TUNEL in tumor tissues of different treatment groups. **p = 0.0052, ***p = 0.0005.

