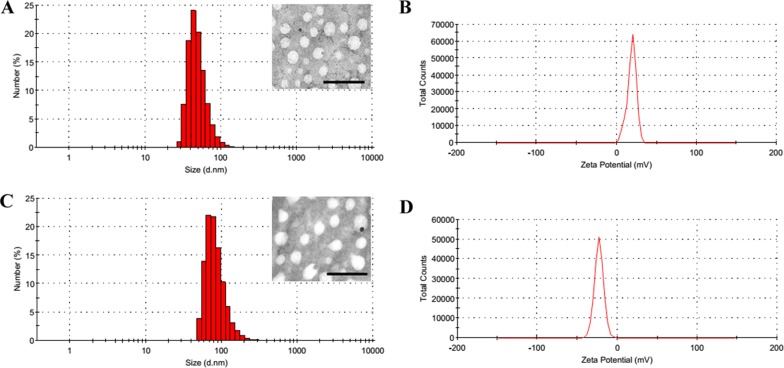
Figure 2. Characterization of PF33/pDNA and RRPHC/pDNA nanoparticles.
(A, B) Hydrodynamic size and zeta potential of PF33/pDNA nanoparticles measured by DLS. Inset: TEM image of PF33/pDNA nanoparticles, scale bar indicates 100 nm. (C, D) Hydrodynamic size and zeta potential of RRPHC/pDNA nanoparticles measured by DLS. Inset: TEM image of RRPHC/pDNA nanoparticles, scale bar indicates 100 nm.

