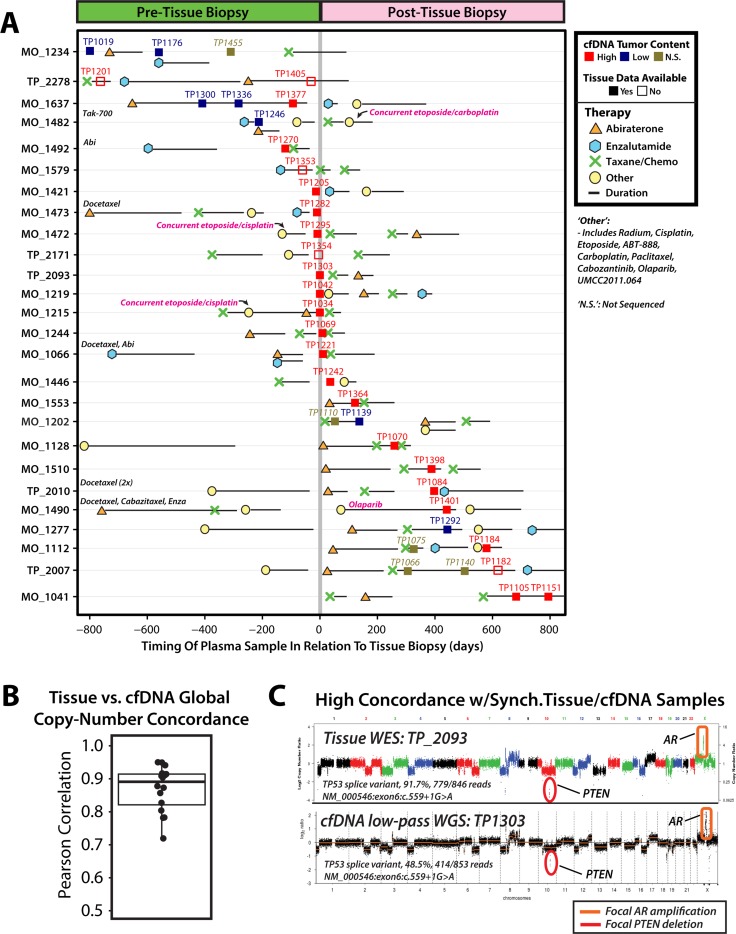
Figure 3. Comparison of synchronous and asynchronous tissue and cfDNA biospecimens collected from patients with metastatic castration-resistant prostate cancer (mCRPC) yields highly concordant genome-wide copy number profiles.
(A) Treatment and cfDNA sample collection timeline plotted in relation to tissue specimen collection date for 26 men with metastatic castration-resistant prostate cancer (mCRPC) eligible for tissue-based comprehensive whole-exome and whole-transcriptome NGS profiling. Treatment start and cfDNA sample dates are plotted relative to tissue specimen collection date (denoted by solid vertical gray line) for each individual. As indicated in the legend, treatments have been divided into 4 separate categories, including: abiraterone (orange triangle), enzalutamide (blue hexagon), taxane-based chemotherapy (green ‘X’) and other (yellow circle), and treatment duration is indicated by solid black horizontal lines extending rightward from treatment start dates. Therapies categorized as ‘other’ include: radium, cisplatin, etoposide, ABT-888, carboplatin, paclitaxel, cabozantinib, olaparib, and UMCC2011.064. Where appropriate, ‘other’ treatment including etoposide and cisplatin or carboplatin for individuals with prostate cancer containing small cell/neuroendocrine features are noted. As indicated in the legend, samples are colored by LSS-based tumor content approximation with high (LSS > 0.1, red), low (LSS < 0.1, blue), and not sequenced (‘N.S.’, brown). For a subset of men, tissue-based molecular data was not available, as indicated by filled (tissue data available) or unfilled (tissue data not available) squares. Displayed sample dates are restricted to +/− 800 days from date of tissue specimen collection, and therapies administered > 800 days before tissue specimen collection are written at the left-hand side of corresponding individual timelines. (B) Correlations between genome-wide tissue and cfDNA segmented copy-number profiles are plotted for 16 patients with available comprehensive tissue NGS profiling data and PRINCe assessment of ≥ 1 high tumor content cfDNA sample (see Methods). Each point represents the correlation of genome-wide copy number profile for a single cfDNA sample as compared to the patient-matched tissue-based copy-number profile. A box-and-whisker plot behind points indicates the interquartile range (IQR), with the top and bottom of box representing 25th and 75th percentile, respectively, while bold horizontal line within the box represents the median correlation value. Whiskers stretch to 1.5 times the IQR for this sample distribution. (C) Tissue whole exome sequencing (WES) (top; tissue id: TP_2093) and cfDNA low-pass whole genome sequencing (WGS) (bottom; cfDNA id: TP1303) genome-wide copy-number profiles for biospecimens collected on the same day from a patient with mCRPC (TP_2093). Genome-wide copy-number concordance is statistically significant (Pearson correlation coefficient: 0.94, p < 0.001), and focal 2-copy deletion of PTEN and focal high-level AR amplification are cleared detected in both the tissue and cfDNA as indicated. A TP53 splice variant (NM_000546:exon 6:c.559+1G>A) identified via WES tissue profiling (91.7% variant fraction (VF), 846 covering reads) is also detected by cfDNA targeted NGS (48.5% VF, 853 covering reads).

