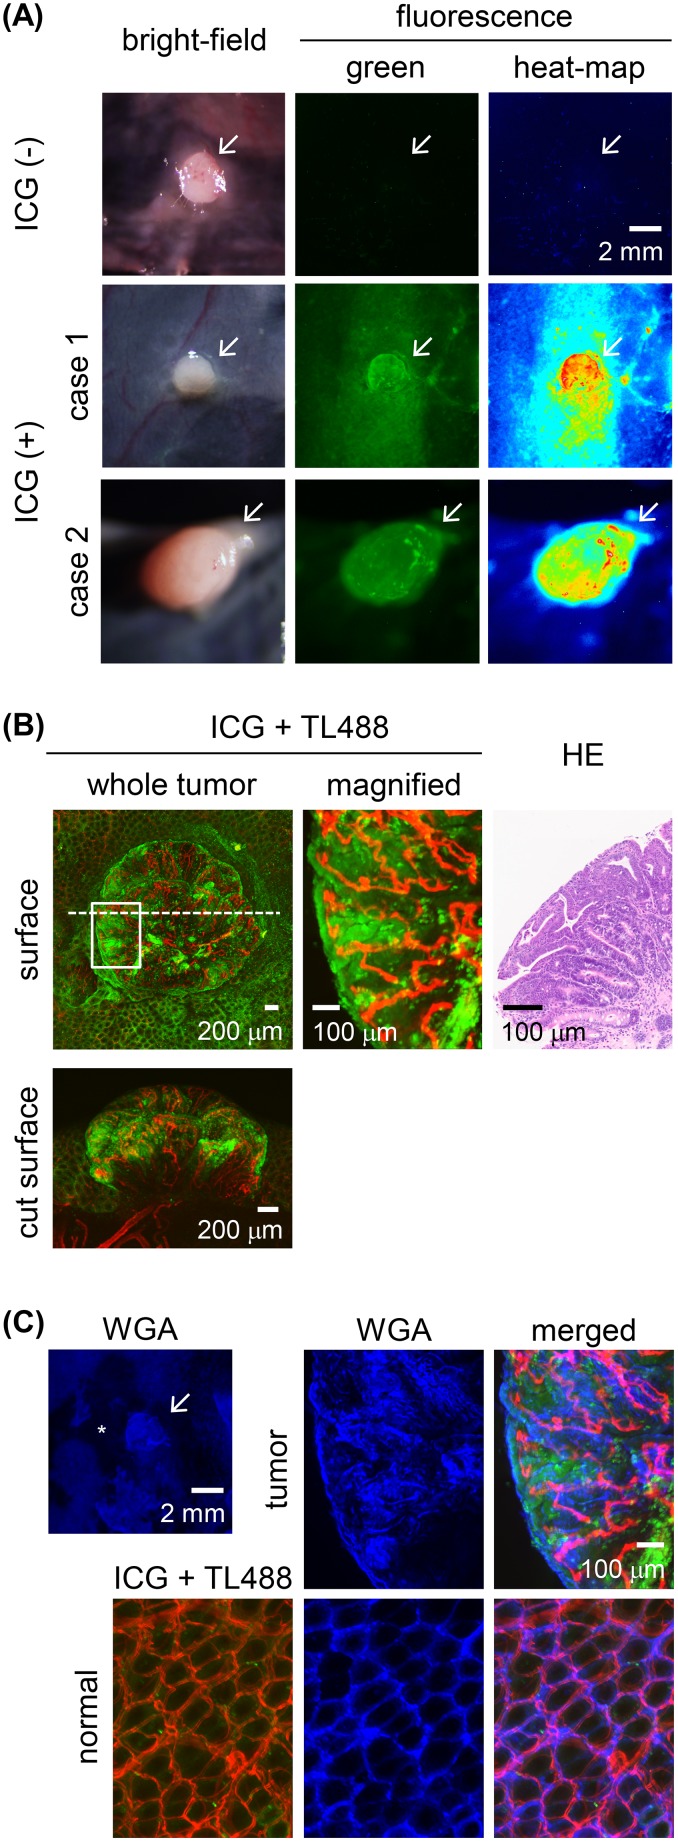
Figure 3. Ex vivo ICG-fluorescence imaging of colon tumors in azoxymethane (AOM)-induced colon carcinogenesis in rats after a 30-min ICG enema.
(A) Wide-field images of colon adenoma tissues incubated in the presence or absence of ICG. Left panels: bright-field images. Middle panels: fluorescence images with pseudo-colored green. Right panels: fluorescence images with pseudo-colored heat map. Representative ICG+ colon adenomas are shown in case 1 and case 2. Colon adenoma in case 2 was developed at the position next to the cecum. Arrow: colon adenoma. Scale bar, 2 mm. (B) High-power view of the ICG+ (green) colon adenoma shown in the case 1 of the panel (A). Fluorescence images of the tumor surface as shown in the boxed areas and by the dashed line indicate the field-of-view of the magnified image and the tumor cut plane, respectively. Blood vessels were stained with Lycopersicon esculentum (tomato) lectin conjugated with DyLight 488 (TL488; red). Image of a hematoxylin & eosin (HE)-stained section of the colon tumor corresponding to the ex vivo image. Scale bar for the whole-tumor view, 200 μm; for the magnified view, 100 μm. (C) Fluorescent wheat germ agglutinin (WGA; blue) stained images of ICG+ (green) colon adenoma tissues shown in the case 1 of the panel (A). Blood vessels were stained with TL488 (red). Asterisk indicates the area where mucus was removed during staining procedure. Scale bar for the whole-tumor view, 2 mm; for the magnified view, 100 μm.

