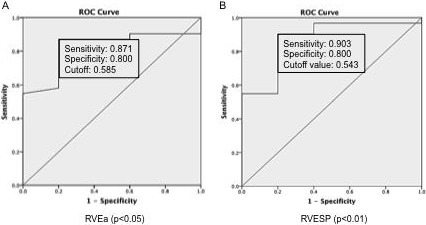
Figure 3.

Receiver operating characteristic (ROC) curves of RVEa (Panel A) and RVESP (Panel B). ROC curves were constructed as plots of sensitivity versus 1 specificity when NYHA classes II and III were considered as positive. The values of sensitivity and specificity were indicated.
