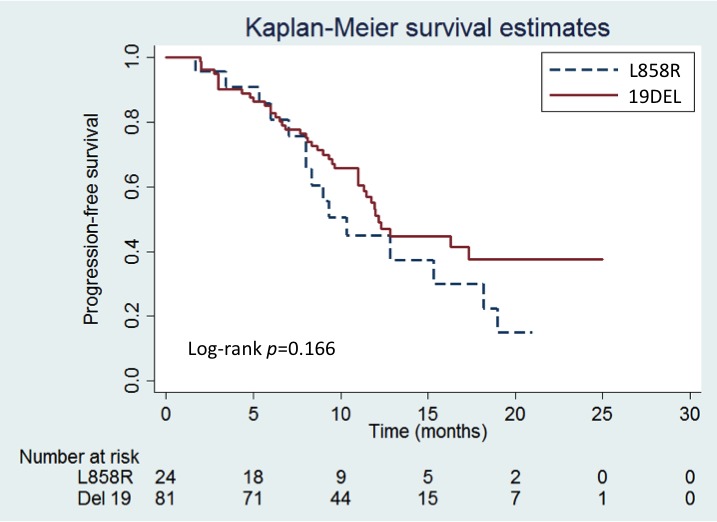
Figure 5. Kaplan-Meier progression-free survival (PFS) curves of patients with an exon 19 deletion (19DEL) vs. p.L858R mutation.

Patients with the 19DEL are represented by the solid (red) line and patients with the p.L858R mutation are represented by the dashed (blue) line.
