Figure 1.
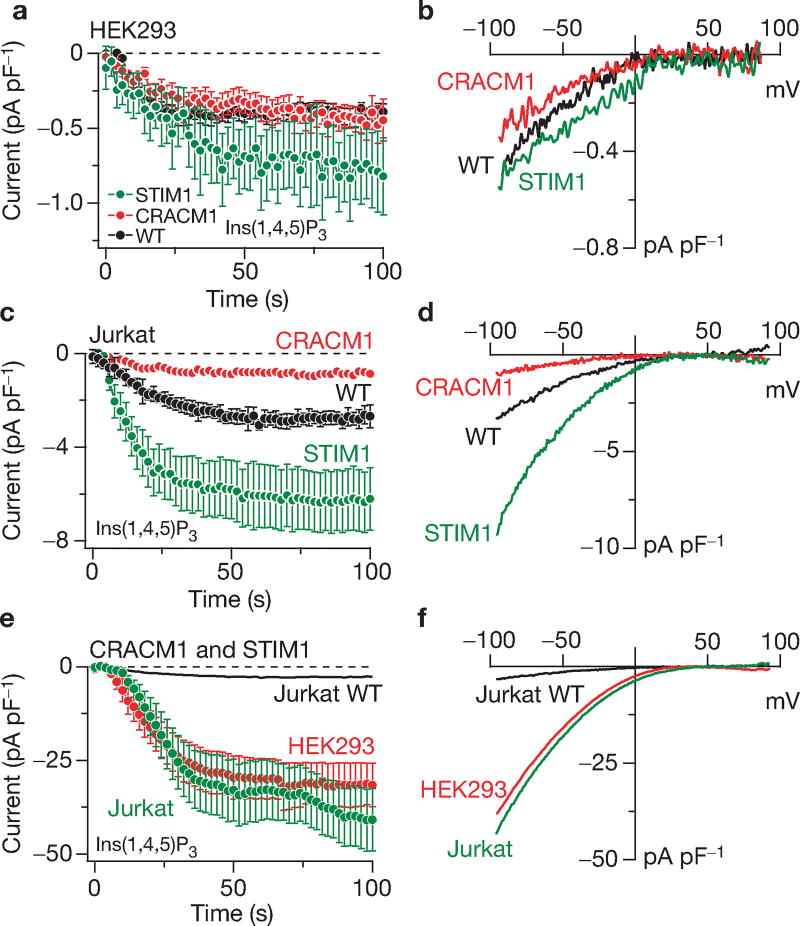
Individual and combined overexpression of STIM1 and CRACM1. (a) Normalized average time course of Ins(1,4,5)P3-induced (20 µM) ICRAC in HEK293 cells. Currents of individual cells were measured at −80 mV, normalized by their respective cell size, averaged and plotted versus time (± s.e.m.). Cytosolic calcium was clamped to near zero with 10 mM BAPTA. Traces represent native ICRAC in wild-type cells (WT, black circles: n = 10), cells transfected with CRACM1 + GFP (red circles; n = 28) or STIM1 + GFP expressing cells (green circles; n = 13). (b) Average current–voltage (I/V) relationships of ICRAC extracted from representative HEK293 cells at 60 s, representing leak-subtracted currents evoked by 50 ms voltage ramps from −100 to +100 mV, normalized to cell size (pF). Traces represent native ICRAC in wild-type cells (n = 6), cells transfected with CRACM1 + GFP (n = 13) and STIM1 + GFP expressing cells (n = 5). (c) Normalized average time course of Ins(1,4,5)P3-induced (20 µM) ICRAC in Jurkat cells. Currents were analysed as in a (n = 21 for control; n = 11 for CRACM1; n = 12 for STIM1). (d) Averaged I/V traces of ICRAC extracted from representative Jurkat cells at 60 s. Analysis as in b (n = 19 for wild type; n = 7 for CRACM1; n = 12 for STIM1). (e) Normalized average time course of ICRAC in HEK293 or Jurkat cells expressing STIM1 + CRACM1. Analysis as in a (n = 14 for HEK293; n = 17 for Jurkat cells). The time course of ICRAC in wild-type Jurkat cells is included for comparison (same data as in c). (f) Average current–voltage (I/V) data traces of ICRAC extracted from representative HEK293 (red) or Jurkat cells (green) expressing STIM1 + CRACM1. Analysis as in b (n = 14 for HEK293; n = 17 for Jurkat cells). The Jurkat wild-type data trace is plotted for comparison (same data as in d).

