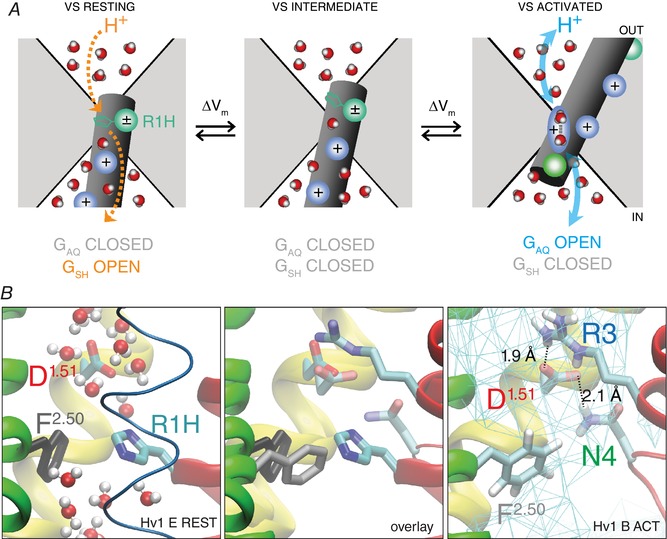
Figure 1. Cartoon and atomic models of hydrated central crevice in Hv1.

A, cartoon of Hv1 VS domain in resting‐ (left), intermediate‐ (centre) and activated‐state (right) conformations. Solvent‐accessible vestibules extend toward the centre of the membrane from the extracellular (out) and intracellular (in) sides of the protein, creating an hourglass‐shaped central crevice (white area) that is bounded by protein (grey area). The S4 helix is represented as a dark grey cylinder, and the positions of conserved Arg gating charge residues are indicated by shaded blue spheres; the shaded teal sphere (left panel) represents the R205H (R1H) mutation and the side chain is shown in stick representation; the shaded green sphere (right panel) represents N214 (N4.46; N4). Water molecules are schematically shown in coloured space‐filling representation (oxygen, red; hydrogen, white). At large negative potentials (i.e. < −80 mV) the VS adopts a resting‐state conformation (left panel) in which R1 is located midway across the membrane where the electrical field is most highly focused and within the hydrated central crevice; in this location, hydrogen bonds formed between imidazole/imidizolium nitrogen(s) and intra‐ or extracellular water molecules catalyse PT via the G SH mechanism (dashed orange arrows). At intermediate voltages (i.e. −50 to −30 mV), R1H is moved outward to a position where the R1H side chain is no longer positioned to catalyse transmembrane PT via G SH (centre panel). In resting‐ and intermediate‐state conformations, one or more S4 guanidinium+ gating charges block the central crevice, and PT via G AQ is prevented. At more depolarized potentials (i.e. > 0 mV), S4 has moved sufficiently far that waters in the central crevice are accessible to intra‐ and extracellular H+, and Grotthuss‐type PT (blue arrows) in a network of hydrogen‐bonded waters (shaded blue oval schematically represents the Zundel cation, H5O2 +) and G AQ is therefore open (right panel). B, snapshots taken from MD simulations of Hv1 B (Ramsey et al. 2010) activated state (centre and right panels) and Hv1 E (Randolph et al. 2016) R1H resting state (centre and left panels) systems show magnified side views of Hv1 VS domain model structures in isolation and in overlay (MultiSeq STAMP structural alignment, VMD 1.9.3; http://www.ks.uiuc.edu). Helical segments are represented as coloured ribbons (S1, yellow; S2, green; S3, blue; S4, red), except where omitted for clarity (centre and right panels). Side chains of selected residues are shown in stick representation (colour‐coded by atom type: carbon, cyan; nitrogen, blue; oxygen, red; hydrogens, white; H atoms are omitted for clarity in left and centre panels), and indicated by labels (red, D112/D1.51; cyan, R205H/R4.47H/R1H; blue, R211/R4.53/R3; green, N214/N4.56/N4; grey, F150/F2.50); residue numbering is as described previously (Randolph et al. 2016). Water molecules in the Hv1 E system are shown in CPK representation coloured by atom type (red, oxygen; white, hydrogen); waters are omitted for clarity in the centre and right panels. Solid cyan lines (right panel) indicate average water density measured during a 50 ns MD simulation and dashed lines and labels indicate distances between the indicated atoms measured at the end the trajectory, illustrating that D1.51 and R3 engage in multiple close‐range interactions with nearby side chains and water molecules and are unlikely to exclusively form a bidentate pair, as depicted in a previous study (Dudev et al. 2015).
