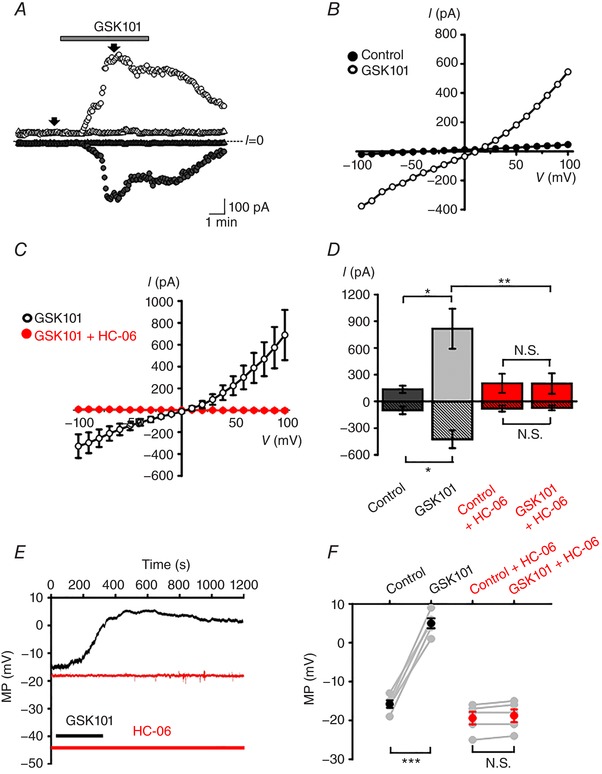
Figure 3. TRPV4 is functionally expressed in HrMVECs, and associated with non‐selective cation conductance.

A, voltage clamp. Representative time courses of whole cell currents in control (circles) and HC‐06 (5 μm)‐treated (triangles) cells held at −100 mV (filled symbols) and +100 mV (open symbols). HC‐06 was applied 3 min prior to the stimulation with GSK101 (3 nm). Arrows indicate time points where the current amplitude values were taken for analysis. B, conductances evoked by ramping the holding potential from −100 to +100 mV. The I–V relationship for the cell shown in A was generated by subtracting controls from GSK101‐evoked responses. C, averaged I–V curves from control (black trace, n = 10 cells) and HC‐06‐treated (red trace, n = 10) cells. D, summary of amplitude values derived from I–V curves at −100 mV (stippled bars) and 100 mV (open bars). Shown are the mean ± SEM values. * P < 0.05; ** P < 0.01; N.S. P > 0.05; paired t test. E, current clamp. Representative membrane potential (MP) responses to GSK101 in control untreated (black) and HC‐06 treated (red) cells. F, summary for the depolarizing effect of GSK101 on the membrane potential (MP) in control (*** P < 0.001, paired t test, n = 5 cells) and HC‐06‐treated (N.S., P > 0.05, paired t test, n = 5) cells. [Color figure can be viewed at wileyonlinelibrary.com]
