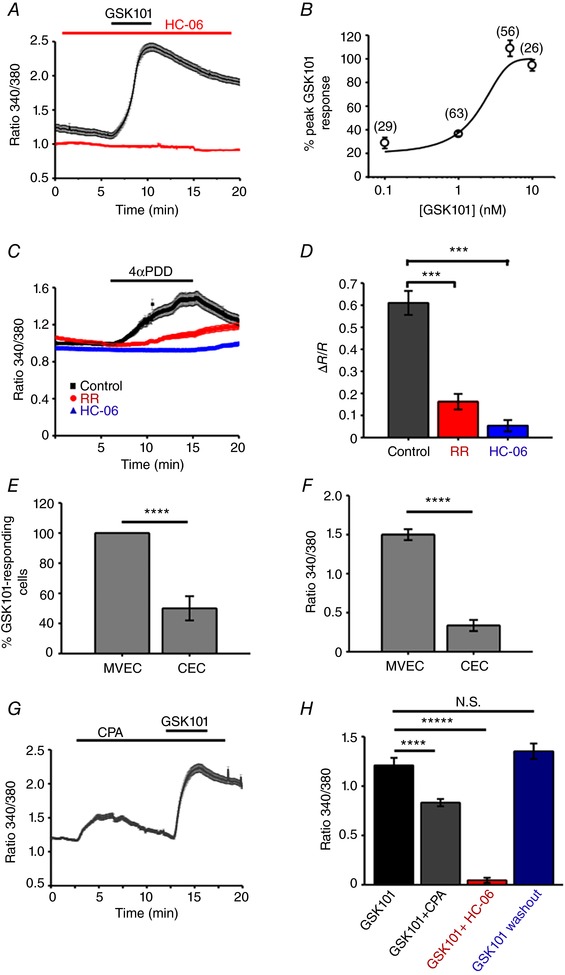
Figure 4. TRPV4 activation elevates [Ca2+]i in HrMVECs.

A, 340/380 Fura‐2 ratio signals. GSK101 (1 nm) elevates [Ca2+]i in a representative experiment (n = 12 MVECs), an effect that is inhibited by HC‐06 (5 μm). B, the dose–response curve for the GSC101‐induced [Ca2+]i increases. Shown in parentheses are the numbers of studied cells. C, Ruthenium Red (RR) and HC‐06 inhibit 4α‐PDD‐mediated rise in [Ca2+]i. ±SEM show the inter‐cell variability at each time point in this representative experiment. D, summary of RR and HC‐06 effects on 4α‐PDD‐induced [Ca2+]i elevations. Mean ± SEM. *** P < 0.001, n = 102, n = 61 and n = 53 cells for control, RR and HC‐06, respectively; paired t test. E, a subset of HCECs responded to GSK101 (25 nm); the number of CEC responders (37.5 ± 10%) is markedly lower compared to HrMVECs responders (∼100%) to a much lower (1 nm) GSK101 concentration (P < 0.001). F, peak amplitude GSK101‐evoked ΔR/R [Ca2+]i signals in HrMVECs are significantly larger than in HCECs (P < 0.001). G, 340/380 ratio. CPA (10 μm) elevates [Ca2+]i and reduces the absolute amplitude of GSK101‐evoked [Ca2+]i elevations. H, ΔR/R responses. Summary of the fluorescence measurements in cells stimulated with GSK101, GSK101 + CPA and GSK101 + HC‐06 (N ≥ 3 independent experiments per condition). [Color figure can be viewed at wileyonlinelibrary.com]
