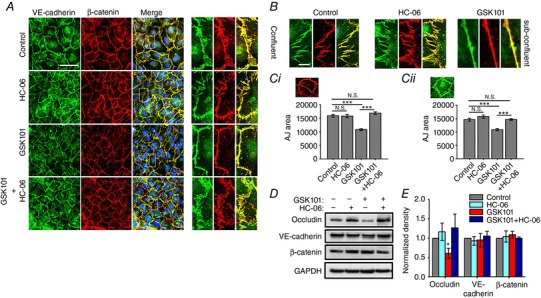
Figure 6. TRPV4 agonist triggers reorganization of cell‐cell junctions.

A and B, VE‐cadherin‐ir (green) and β‐catenin‐ir (red) in confluent (A) and sub‐confluent cells (B) in the presence of GSK101, HC‐06 and GSK101/HC‐06. Merged images in A include DAPI staining (blue). Scale bar = 50 μm. The panels on the right show high‐resolution images. Scale bar = 10 μm. C, summary of the effects of TRPV4 agonist/antagonist on AJ overlap. Overlap was quantified by tracing the β‐catenin‐ir boundary (Ca) in adjacent cells. Quantification of VE‐cadherin‐ir areas (Cb). Paired t test, N = 3 independent experiments. D, western blots. Protein levels of occludin, but not VE‐cadherin and β‐catenin are lowered following exposure to GSK101 (5 nm). E, relative protein density from experiments shown in D, normalized to control, *** P < 0.0001 (N = 3 independent experiments). [Color figure can be viewed at wileyonlinelibrary.com]
