
Figure 5. Time domain analysis of HRV in animals (n = 8) in response to cyclic RCV delivered at the neural fulcrum (grey bars) vs. the same animals with sham VNS (black bars).
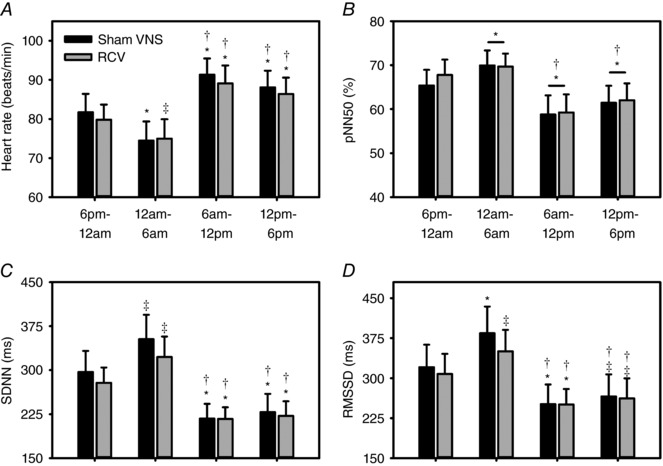
Data are subdivided into 6 h time segments starting at 18.00 h. Shown are heart rate (A), and indices of heart rate variability including pNN50 (%) (B), SDNN (C) and RMSSD (D). ‡ P ≤ 0.040 vs. 18.00–00.00 h; * P ≤ 0.010 vs. 18.00–00.00 h; and † P ≤ 0.001 vs. 00.00–06.00 h.