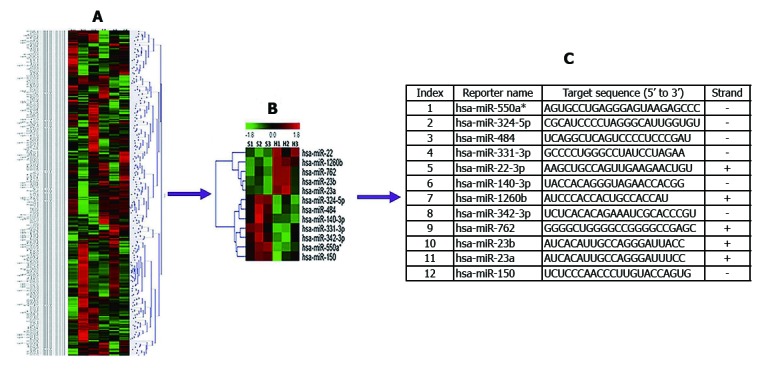
Figure 1.

Circulating miRNA expression in patients with SAP with ALI and those with SAP without ALI. A and B: Differentially expressed miRNAs (P < 0.05) were analyzed by hierarchical clustering of the log2 values of miRNA microarray signals. Red: Up-regulation; Green: Down-regulation; Black: No change. The legend on the right displays the miRNA represented in the corresponding row. The bar code on the top represents the color scale of the log2 values. The heatmap shows 12 significantly expressed circulating miRNAs in patients with SAP with ALI and SAP without ALI using miRNA array data; C: Information and expression of 12 circulating miRNAs. ALI: Acute lung injury; miRNA: microRNA; SAP: Severe acute pancreatitis.
