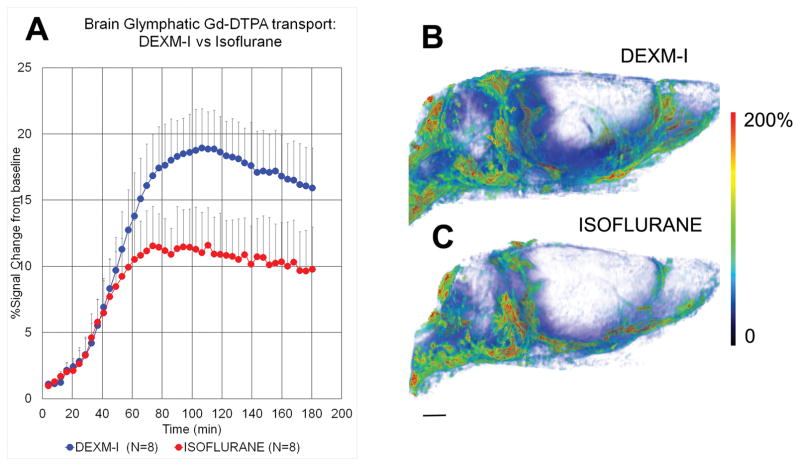
Fig. 1. Dexmedetomidine and low-dose isoflurane (DEXM-I) enhances glymphatic transport of Gd-DTPA in comparison to isoflurane.
A: Average time signal curves (TSC) of Gd-DTPA induced signal changes from whole brain of rats anesthetized with DEXM-I (blue, filled circles) and isoflurane (red, filled circles). The TSCs were extracted from the dynamic contrast-enhanced T1-weighted MRIs and represent glymphatic transport of brain parenchyma (excluding cerebrospinal fluid compartment). There is overall more whole brain uptake (as measured by % signal change from baseline) of Gd-DTPA in the DEXM-I anesthetized rats when compared to isoflurane (see result section for quantitative details). The data are expressed as mean ± SD. B and C: 3D volume rendered color-coded maps of Gd-DTPA induced signal changes 2hrs after administration of contrast into the CSF from a rat anesthetized with DEXM-I (B) and isoflurane (C). The red and blue colors represent high and low contrast uptake, respectively. Over the first 2 hrs of contrast circulation more contrast had penetrated the brain in the DEXM-I rat (B) when compared to isoflurane (C). Scale bar: 3 mm.

