
Figure 1. DOK3-deficient mice are osteoporotic.
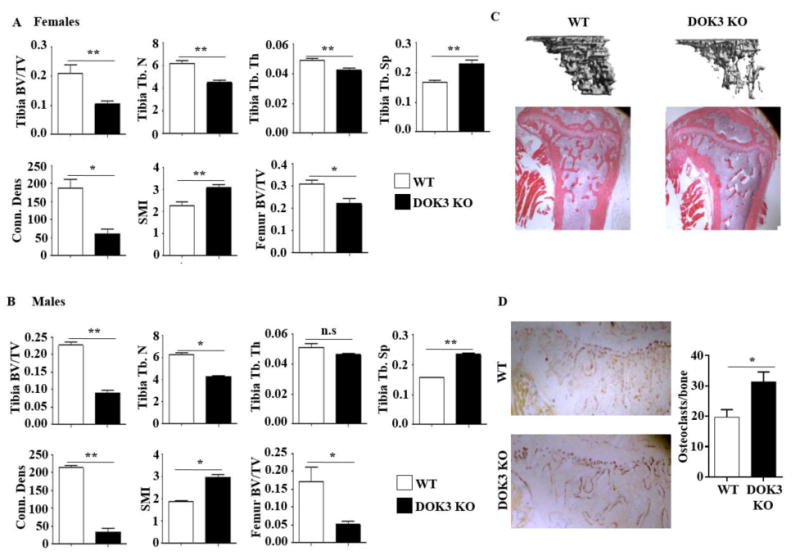
(A and B) Proximal tibias and distal femurs of 16-week-old female (A) or male (B) WT or DOK3-/- mice were scanned by microCT (n = 7∼9 each sex and genotype). Reconstructed tibias were analyzed for bone volume per tissue volume (BV/TV), trabecular number (Tb. N), trabecular thickness (Tb. Th), trabecular spacing (Tb. Sp), connection density (Conn. Dens), and structural model index (SMI). (C) Representative images of microCT reconstruction of proximal tibia (top) and H&E bone histology of 16-week-old male mice (bottom, original magnification: 20×). (D) TRAP stained tibia bones sections. TRAP+cells attached to bone were quantified. Data representative of >75 images quantified. n = 4 mice per group, original magnification: 40×. Statistical values were calculated using a Student's t-test unless otherwise indicated, *p < 0.05, **p < 0.01, n.s: no significance. Error bars indicate the mean ± SD.