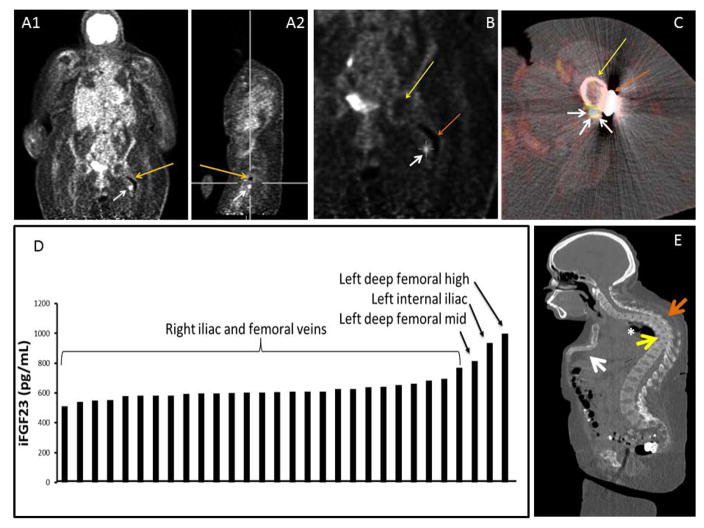
Figure 1.
Localization studies subject 1: Panel A. FDG-PET coronal (A1) and sagittal image (A2) showing artifact from rod (orange arrow) and culprit tumor (white arrow). Panel B: Coronal view of FDG-PET scan localizing the lesion (white arrow), femoral head (yellow arrow) and rod (orange arrow). Panel c: Axial view of FDG-PET/CT fusion imaging localizing the lesion-white arrows point the tumor, yellow arrow points the femoral shaft and orange arrow points the side plate. Panel D. Selective venous sampling for intact FGF23. There was a significant step-up in FGF23 concentration as the suspected tumor venous drainage was approached anatomically. Panel E. CT-Scan sagittal view showing sternal collapse (white arrow), kyphosis (orange arrow), vertebral compression fractures (yellow arrow) and restrictive lung disease (asterisk).

