
Figure 5.
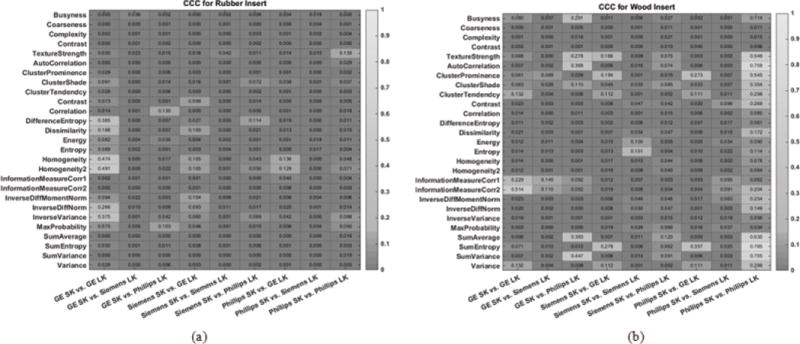
Heatmap consisting of CCC values for the radiomic features evaluated in this study. The CCC (0 to 1) was computed from repeat CT images acquired with different imaging settings for (a) the rubber insert and (b) wood insert. The lighter the shade of gray, the higher the CCC value.