
Figure 6. Kynurenine Supplementation Increases Bone Marrow Adiposity.
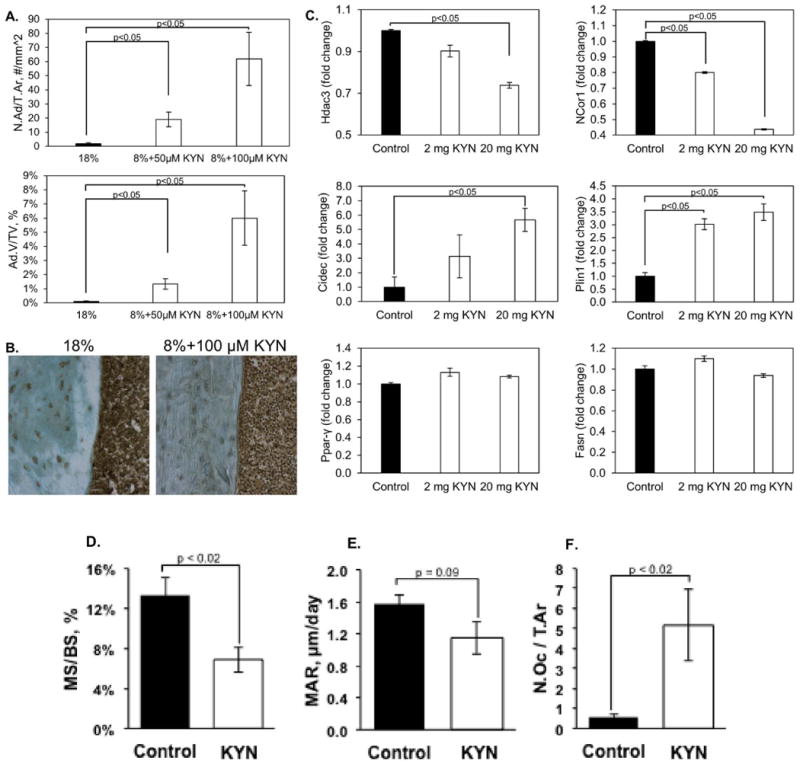
Tibiae from mice fed the four diets were isolated and the bone marrow analyzed for adiposity as described in Methods. (A) Adipocytes were counted and their volume determined. Values represent the mean ± SD, and a dose-dependent increase in both parameters was observed. (B) Representative micrographs of immunostaining for Hdac3 in the cortical bone from the 18% protein group and the 8% protein + 100μM kynurenine. (C) Bone marrow stromal cells were isolated from the humerii of animals injected with kynurenine and the expression of Hdac3 and its cofactor NCoR1, as well as lipid storage genes and adipocyte markers, was determined by quantitative RT-PCR as described in Methods. Values are expressed as means ± SEM of n=3. (D-F) Tibiae from mice injected with vehicle (control) or 20 mg/kg kynurenine were histologically analyzed as described in Methods. Mineralizing surface (D), mineral apposition rate (E), and osteoclast number (F) were quantified. Values represent the mean ± SEM of n=5 mice per group.