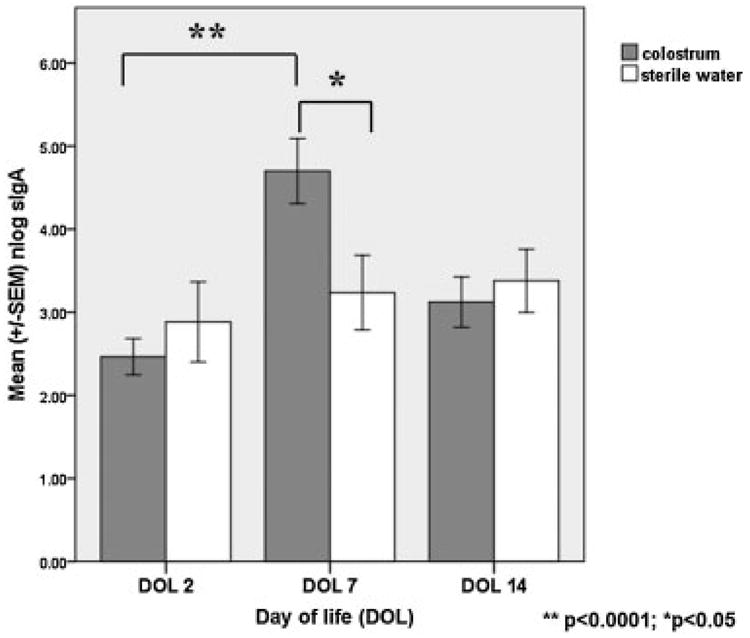
Fig. 2.

Graphical representation of the differences in salivary secretory IgA (SsIgA) between colostrum-treated versus control infants. Note that SsIgA increased from baseline day 2 to day 7 in treatment group infants (**p < 0.00001, paired sample t-test). Conversely, SsIgA did not increase over time in the control group infants. SsIgA at the day of life 7 was statistically higher in the colostrum-treated infants (*p < 0.05; independent samples t-test).
