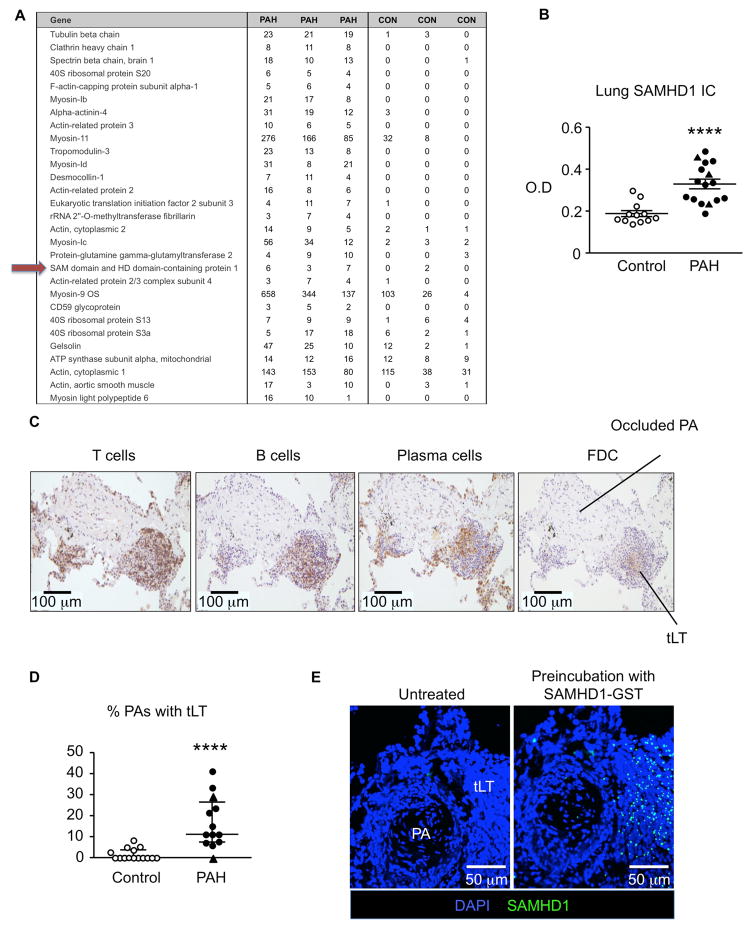
Figure 1. SAMHD1 a target antigen in immune complexes in PAH lungs.
(A) C1q immunoprecipitation followed by liquid chromatography tandem mass spectrometry identified target antigens of immune complexes in PAH (n=3) and control (n=3) lungs. Targets are ranked by q value according to the SAM statistic and all were within the false discovery rate (FDR) of 5%. (B) SAMHD1 immune complexes measured by ELISA in PAH (n=16) and control (n=12) lungs. ****P<0.0001 by Welch test. (C) Representative sections from a PAH lung show tertiary lymphoid tissue (tLT), characterized by positive immunoreactivity to markers of T cells (CD3), B cells (CD19), plasma cells (rough endoplasmic reticulum-associated protein p63) and follicular dendritic cells (FDC; 120 kDa FDC protein). (D) Number of PAs with associated tertiary lymphoid tissue relative to total PAs was calculated as a percentage from lung tissue sections in each control (n=15) and each PAH patient (n=13) and controls. ****P<0.0001 by Mann-Whitney test. (E) SAMHD1 immunoreactive foci in tertiary lymphoid tissue detected by applying recombinant GST-tagged SAMHD1 protein to lung tissue sections, followed by an anti-GST-FITC conjugated antibody Negative controls were treated with PBS, followed by anti-GST-FITC conjugated antibody. Nuclei were stained by DAPI (blue). Ranges represent mean ± SEM (B) and median with interquartile range (D). Closed symbols (PAH), open symbols (controls), closed triangles hereditary PAH (HPAH).

