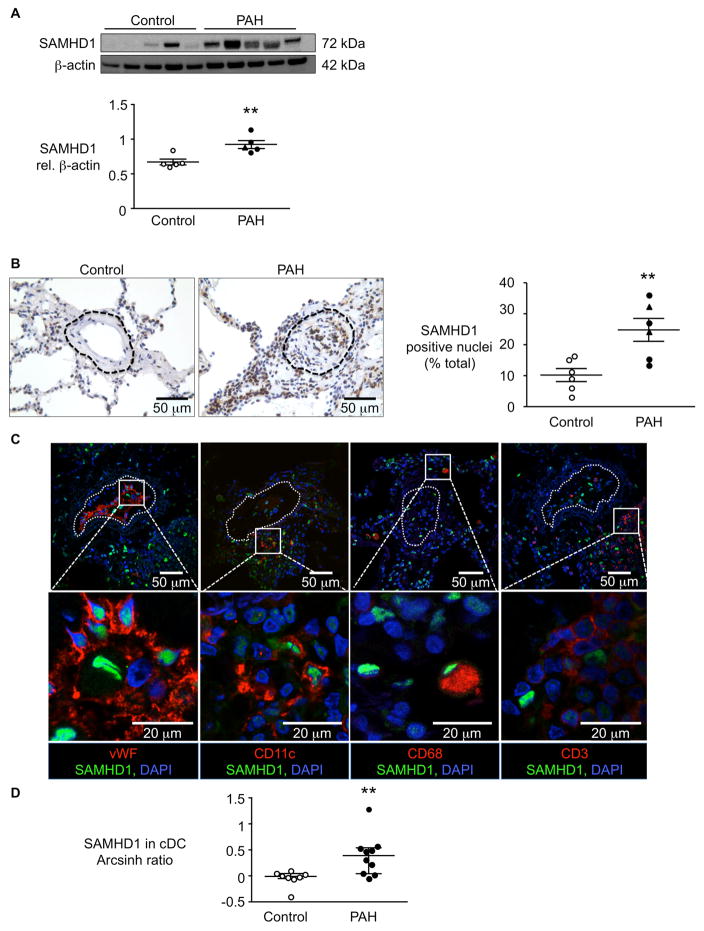
Figure 2. Elevated SAMHD1 in PAH lung cells and in circulating classical dendritic cells (cDC).
(A) Representative western immunoblot with densitometric quantitation of SAMHD1 in lung lysates assessed in PAH (n=5) vs. control (n=5) lungs. **P<0.01 by Student’s t-test. (B) Representative immunohistochemistry of SAMHD1 in pulmonary artery (PA) from a donor (control) lung, and from a PA of similar size and at similar airway level from a lung of a PAH patient. Below, percent nuclei that stained for SAMHD1 in all arteries in a lung section in PAH (n=6) vs. control (n=6) lungs, calculated using the ImmunoRatio program. The dashed line indicates the vessel boundary including the adventitia, within which % SAMHD1 positive cells was calculated. **P<0.01 by Student’s t-test. (C) Confocal microscopic images of sections immunolabeled with SAMHD1 (green), and four lineage markers (red): left to right, vWF (endothelial cells), CD11c (dendritic cells), CD68 (macrophages) and CD3 (T cells). Nuclei were stained with DAPI (blue). Dashed line indicates vessel boundary. (D) SAMHD1 assessed by CyTOF in circulating classical dendritic cells (cDCs) from PAH patients (n=10) or controls (n=8). Data are shown as the calculated difference of inverse hyperbolic sine medians between control and PAH samples (Arcsinh Ratio). **P<0.01 by Mann-Whitney test. Ranges represent mean ± SEM (A, B) and median with interquartile range (D). Closed symbols (PAH), open symbols (controls), closed triangles hereditary PAH (HPAH).

