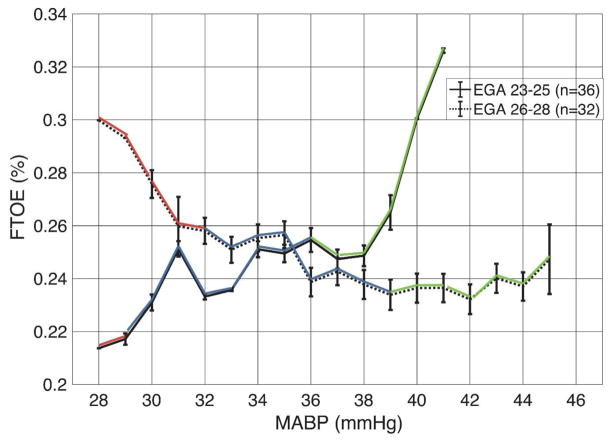
Figure 2.
Blood pressure vs. FTOE is shown for both groups (solid line - 23–25 weeks, dashed line - 26–28 weeks). Blood pressure group is defined by color with low MABP in red, medium in blue, and high in green. Note the increase in FTOE during hypotension for the more mature infants, suggestive of a metabolically-driven autoregulatory response. In contrast, the more preterm group has a paradoxical drop in FTOE, suggesting immaturity of metabolically driven autoregulation. Whiskers represent ±1 SEM.

