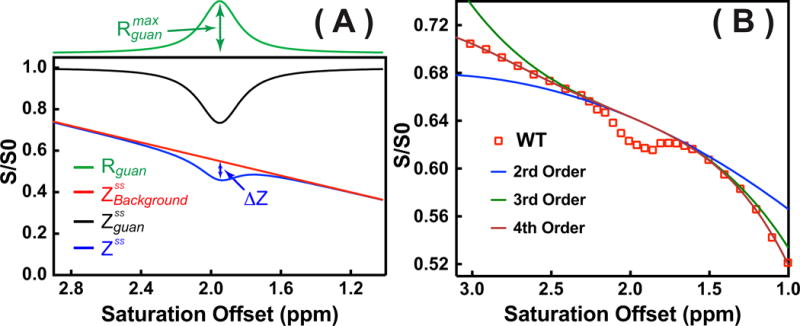
Figure 1.

(A) Example of fitting the Z-spectrum (blue line) consisting of two contributions (Rguan and ) simulated using Eqs. 7,8,10–11. The corresponding calculated from the Rguan using Eq. 7 with R1=0.5 s−1 was also plotted (black line). In the fitting, = 0.2 s−1, w = 0.250 ppm, and 1.95 ppm were used for the Lorentzian line-shape (Rguan), while C0 =0.55, C1=-0.2 were applied for the broad background signal ( ). Other polynomial terms were assumed to be zero in ). ΔZ is the observed pure guanidinium CEST signal. (B) One typical Z-spectrum recorded in WT mouse with 1 μT saturation power and two-second saturation length (Open Square) was plotted together with the fitting using several polynomial functions with different orders (solid lines) defined by Eq. 11.
