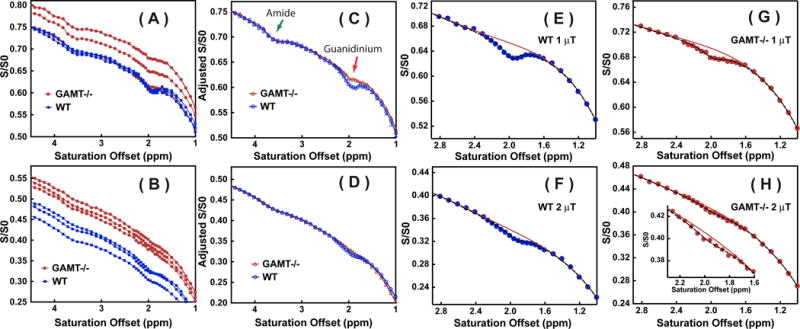
Figure 4.

Z-spectra recorded in WT mice (n = 3) and GAMT−/− mice (n = 3) for the midbrain VOI in Fig. 3 using CW-CEST with saturation powers of 1 μT (A) and 2 μT (B). The Z-spectra collected at 1 μT (C) and 2 μT (D) aligned with the Z-spectrum of one of the WT mice using the signal at 3.5 ppm as a reference for translation along the intensity scale. Fitted Z-spectra (1-3 ppm range, dashed line) for the brain of a WT (E, F) and a GAMT−/− mouse (G, H) with saturation powers of 1 μT (E, G) and 2 μT (F, H), respectively. The inset in Fig. 4H shows the fitting of the small residual. The solid curves are the polynomial fits of signal around 1.95 ppm.
