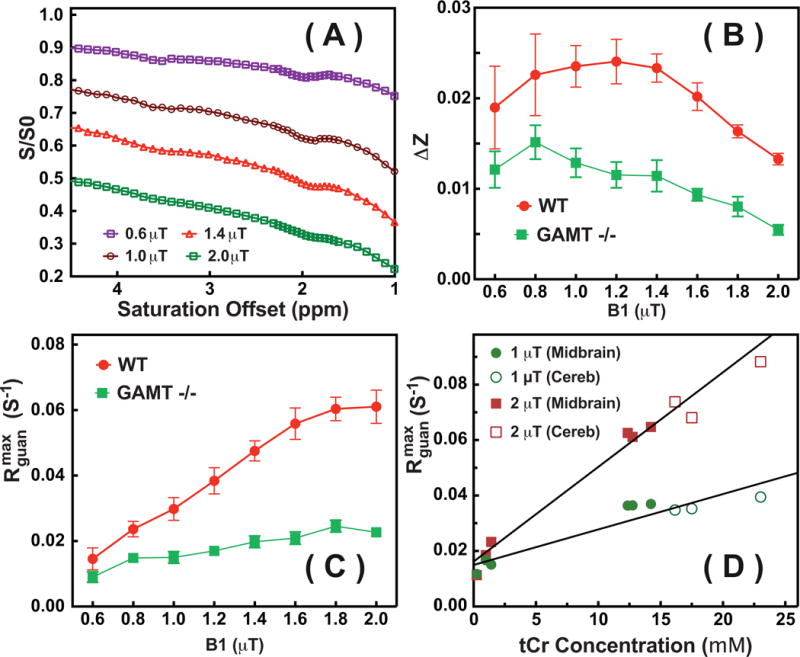
Figure 5.

(A) Typical Z-spectra on WT mouse brain for the VOIs at midbrain shown in Fig. 3 recorded with different saturation powers (0.6 μT, 1 μT, 1.4 μT and 2 μT). (B) The observed guanidinium CEST difference signal ΔZ and (C) the guanidinium CEST signal ( ) with respect to the saturation power for a WT and a GAMT −/− mouse. The error bar represents the standard deviations over the midbrain region. (D) The fitted peak intensities of the guanidinium CEST signals from the midbrain (solid circles and squares) and cerebellum (open circles and squares) of WT mice (n=3) and from the midbrain region of GAMT−/− mice (n=3) with their corresponding tCr concentrations quantified relative to MRS. Lines are the linear least squares fitted curves, leading to = 0.015 s−1 and s−1mM−1 (R2=0.87) for 1 μT and = 0.016 s−1 and s−1mM−1 (R2=0.94) for 2 μT, respectively.
