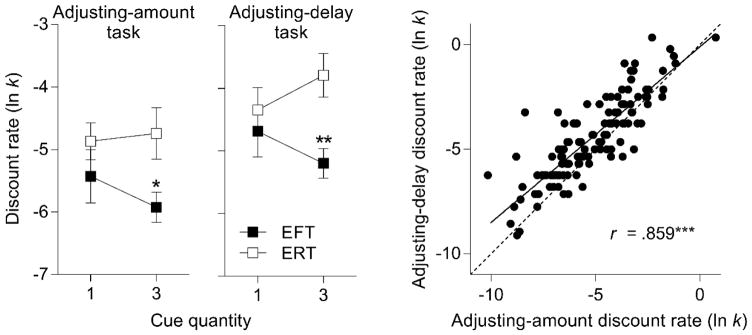
Figure 1.
Discount rate (ln k) for $100 in the adjusting-amount and -delay tasks in EFT and ERT participants assigned to the 1- and 3-cue groups (left panels). Error bars represent standard error of the mean. Also depicted is the correlation in discount rate between tasks (right panel). Solid line represents line of best fit in linear regression; dashed line represents unity. Asterisks indicate significant difference from ERT within the same cue quantity group (left panels) or significant Pearson r correlation (right panel). *p < .05; **p < .01; ***p < .001.

