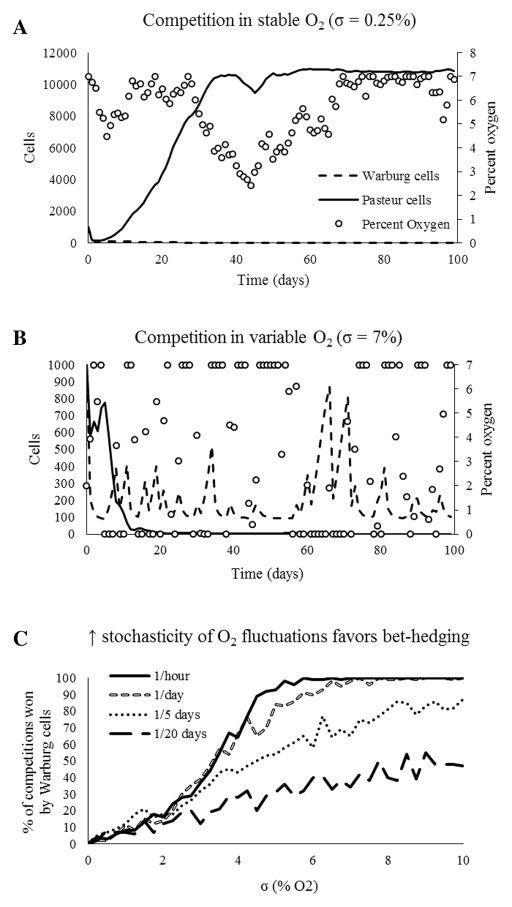
Figure 4.
Simulated competitions between Warburg and Pasteur cells subjected to stochastic temporal variations in oxygen concentration demonstrate that increasing both the amplitude (σ) and frequency of oxygen fluctuations favors the Warburg (bet-hedging) phenotype. In panel C, each data point represents an average of 100 simulated competitions, each lasting 100 days. Pasteur cells dominate competition in an environment with stable oxygen concentrations (panel A), while Warburg cells dominate more variable environments (panel B).

