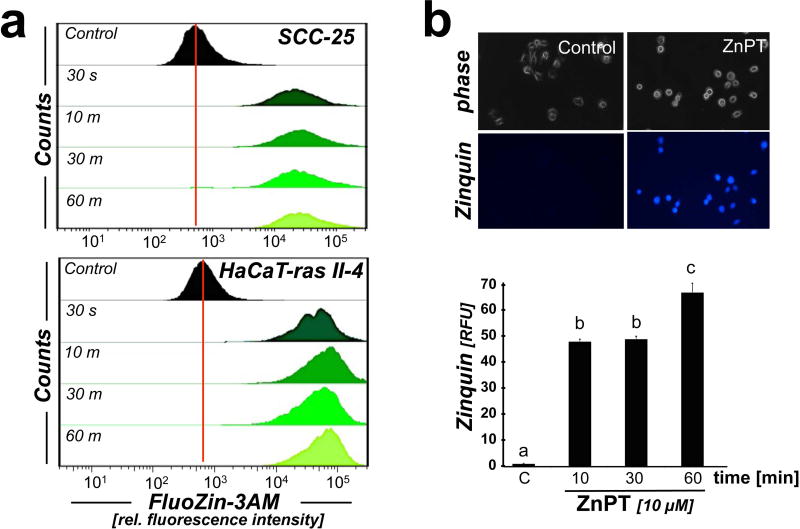
Figure 1. ZnPT-induced zinc overload in malignant human keratinocytes.
(a) Time course analysis of ZnPT-induced (10 µM) intracellular free zinc elevation, monitored by flow cytometric detection of FluoZin-3AM (n=3; upper panel: SCC-25; lower panel: HaCaT-ras II-4). (b) Time course analysis of ZnPT-induced (10 µM; SCC-25) increase of intracellular free zinc as seen by Zinquin-based fluorescence microscopy (upper panel). Bar graph (lower panel) displays quantitative analysis of Zinquin relative fluorescence intensity (n ≥ 85; mean ± SD).

