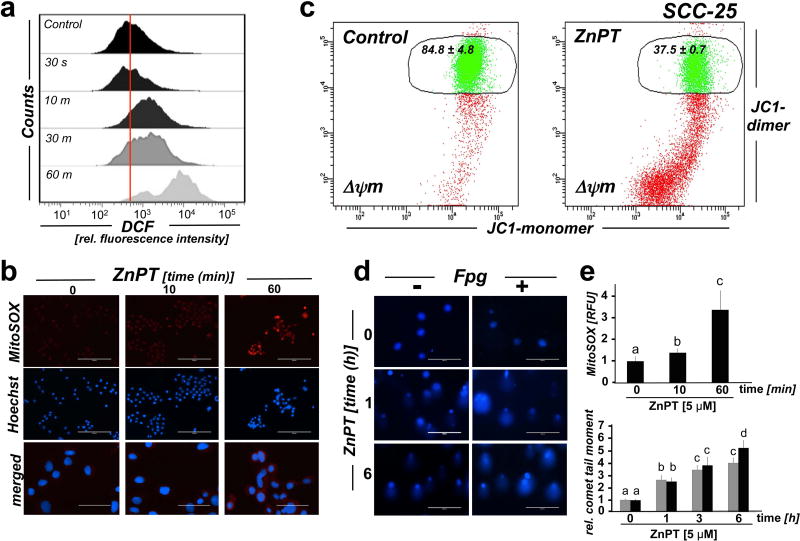
Figure 4. ZnPT-induced mitochondrial redox dysregulation and impairment of genomic integrity in malignant SCC-25 keratinocytes.
Cultured SCC-25 keratinocytes were exposed to ZnPT. (a) Time course analysis of ZnPT (5 µM) induced oxidative stress, monitored by flow cytometric detection of DCF fluorescence intensity. (b) Time course analysis of mitochondrial superoxide production in response to ZnPT (5 µM) exposure using MitoSOX Red™ fluorescence microscopy. (c) Mitochondrial transmembrane depolarization was assessed by flow cytometric analysis of JC-1 stained cells performed upon 1 h continuous exposure to ZnPT [Numbers indicate percentage of cells inside the circle displaying intact Δψm [n=3, mean ± SD (p<0.05)]. (d) Time course analysis of ZnPT-induced (10 µM) impairment of genomic integrity using the comet assay with or without additional Fpg-digest for the visualization of oxidative DNA base damage. (e) Quantitative image analysis. Upper panel: MitoSOX Red™ fluorescence intensity (from panel b); lower panel: Average comet tail moment (from panel d).

