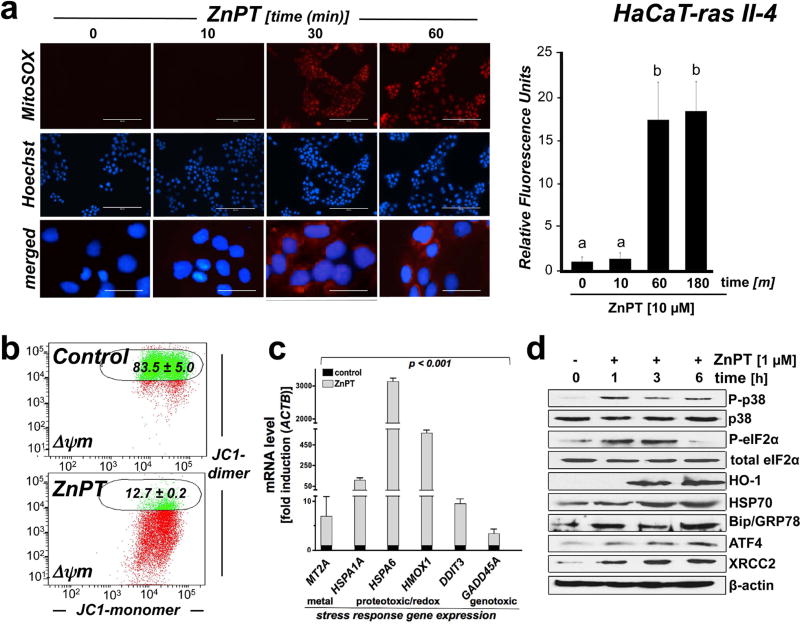
Figure 5. ZnPT-induced mitochondrial redox dysregulation and stress response target gene expression in malignant HaCaT-ras II-4 keratinocytes.
Cultured HaCaT-ras II-4 keratinocytes were exposed to ZnPT. (a) Time course of mitochondrial superoxide production in response to ZnPT (5 µM) as detected by MitoSOX Red™ fluorescence microscopy. Bar graph displays quantitative analysis of relative fluorescence intensity [scale bar: 200 µm (upper panels); 40 µm (overlay)]. (b) Mitochondrial transmembrane depolarization was assessed by JC-1 flow cytometric analysis 1 h after ZnPT (5 µM) treatment; numbers indicate percentage of cells inside the circle displaying intact Δψm [n=3, mean±SD; (p<0.05)]. (c–d) Stress response gene expression in response to ZnPT exposure (1 µM; ≤ 6 h) was determined at the mRNA (fold induction versus ACTB; n =3; mean ± SD) and protein levels using immunoblot analysis (loading control: β-actin).

