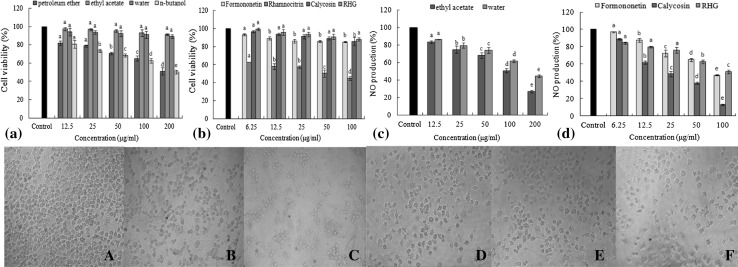
Fig. 6.
Effects of four fractons and four purified compounds on macrophages. The column graphs (a–d) showed the effect of samples on the vitality of macrophages and the inhibitory effect on NO production of samples at different concentrations. The cell images (A–F) showed the cell growth morphology of A control group, B ethyl acetate fraction (200 μg/mL), C water fraction (200 μg/mL), D Formononetin (100 μg/mL), E Calycosin (100 μg/mL) and F RHG (100 μg/mL), respectively, observed with invert microscope. Letters a–e refer to significant differences within a fraction/compound by one-way analysis of variance-Duncan’s multiple range test (p ≤ 0.05)

